 Measuring your pulse or heartbeat is a very common medical procedure. Often, the patient kept under observation is essentially monitored through their pulse/heartbeat.
The pulse rate varies from person to person. The pulse is lower when we are resting because at this time the body does not need much oxygen and the heart can pump blood at a slower rate to supply the oxygen required by the body. The pulse increases when we exercise or are under stress. This is because the body requires more oxygen during these periods and therefore requires more blood to pump through it to meet oxygen needs. The normal pulse rate for children ranges from 70 to ~100 beats per minute. The normal pulse rate for adults is 60 to ~100 beats per minute. To estimate your age-related maximum heart rate, subtract your age from 220.
Critically ill patients are continuously monitored for heart rate, blood pressure, etc. It is common to monitor heart rate graphically in Intensive Care Units (ICU) and High Dependency Units (HDU) in hospitals.
In this project, we designed two models of pulse rate monitor. One model displays only heartbeats per minute. The second model also graphically displays heart rate.
Both models are designed on Arduino UNO. The display unit is an SSD1306 OLED screen. The pulse sensor used to design the project is the XD-58C sensor.

The XD-58C is a low-power plug-and-play analog heart rate sensor, easily connected to any microcontroller or single-board computer that allows analog input. This sensor is very compact – the size of a button and extremely practical.
XD58C pulse sensor
The XD58C is a low-cost optical heart rate sensor designed and manufactured by World Famous Electronics. This is an open source hardware project by Joel Murphy and Yury Gitman. You can learn more about this open source hardware project at pulsesensor.com.
The sensor is made from an Avago APDS-9008 ambient light sensor and a Kingbright AM2520ZGC09 reverse mount green LED. The front of the sensor is indicated by a heart-shaped figure, where you can place your finger on Kingbright's reverse-mounted green LED. On the back of the sensor is Microchip's MCP6001 operational amplifier with the rest of the circuitry forming a network of RC filters. The new version of the pulse sensor has diode protection on the power line, so if the power cables are reversed by mistake, the sensor will not be damaged.
The operating voltage of the XD85C pulse sensor is 3V to 5.5V DC and the required current is 3~4 mA. The sensor's operating temperature range is -40˚C to 85˚C. The sensor has three terminals – GND, VCC and Signal.
How optical heart rate sensors work
An optical pulse sensor shines green light (~550 nm) and measures the amount of light reflected back using a photosensor. The XD85C has a 565 nm LED output and its photo sensor has a 525 nm input. Oxygenated hemoglobin in arterial blood tends to absorb green light. Higher is the hemoglobin in the blood; more green light is absorbed. During each heartbeat, blood is pumped through the finger/earlobe. As a result, the amount of reflected light changes with the flow of blood. This produces a variable waveform at the photosensor. As multiple photosensor readings are taken, a heartbeat frequency is obtained. This method of detecting heart rate using green light is called a photoplethysmogram.
The photosensor output is filtered through an RC network and amplified to a level sufficient to remove noise and obtain a clearer signal. The graphical display of heartbeat is just the graphical representation of the variation in blood flow through the finger or earlobe.
Interfacing the XD85C pulse sensor with Arduino
The XD85C can be directly connected to Arduino and other microcontrollers. The pulse sensor has three terminals – VCC, GND and Signal. Connect the VCC and GND pins to the Arduino's 5V output and ground respectively. Connect the signal cable to any of the controller's analog inputs.
Pulse Sensor Library
The XD85C pulse sensor from World Famous Electronics LLC has a well-documented Arduino library. The library is called “PulseSensor Playground”. It can be included by navigating to Sketch->Include Library -> Manage Libraries and searching for “pulsesensor”. The library comes with many example sketches that can be tried to test the sensor. Once the library is installed, these example sketches can be explored by navigating to File -> Examples -> PulseSensor Playground once the library is installed. These example libraries are useful for detecting the pulse rate in the Arduino Serial Monitor and visualizing the pulse in the Arduino Serial Plotter and Processing Visualizer.
In this project, we will trace the heartbeat and indicate the heartbeat measurement on a display unit, which is the SSD1306 OLED screen. The pulse sensor library does not provide functions or examples that allow you to use raw data to plot your heartbeat. Let's start building our heart rate monitor. There are two models designed here. Model 1 only displays heart rate on the OLED screen. Model 2 also displays a heart rate graph.
Heart rate monitor model 1
In this model, we will only detect the pulse frequency and display it on an OLED screen.
Required components
- Arduino UNO/any Arduino board x1
- Pulse sensor XD85C x1
- SSD1306 128×64 OLEDx1
- Jumper wires/connection wires
Circuit Connections
To connect the pulse sensor to the Arduino UNO, connect VCC and GND to the 3.3V output and ground the Arduino respectively. Connect the signal cable to the Arduino UNO analog input pin A0. In this project, a 7-pin SSD1306 OLED module is connected to Arduino UNO. The module is connected to the Arduino, as shown in the following table.

 Arduino Sketch
How the circuit works
This model uses the official pulse sensor library. It uses Arduino interrupts to measure the pulse rate. Interruptions are used to determine the time interval between each beat, and the number of beats per minute is evaluated accordingly. Beating is detected by comparing the analog signal value with a threshold value. If the signal value exceeds the threshold, one beat will be counted. The interrupt is generated every time a beat is detected.
The code
The sketch starts by telling Arduino to use the interrupt and then importing the Pulsesensor Playground library. SPI and Adafruit libraries for SSD1306 OLED are imported. Constants for OLED display are declared. Similarly, constants are defined for pulse sensors. The OLED display is initialized and the bitmap that stores the icon for “EEWORLDONLINE” is set to PROGMEM. The bitmap is converted to an array. An object of the pulse sensor class is declared.
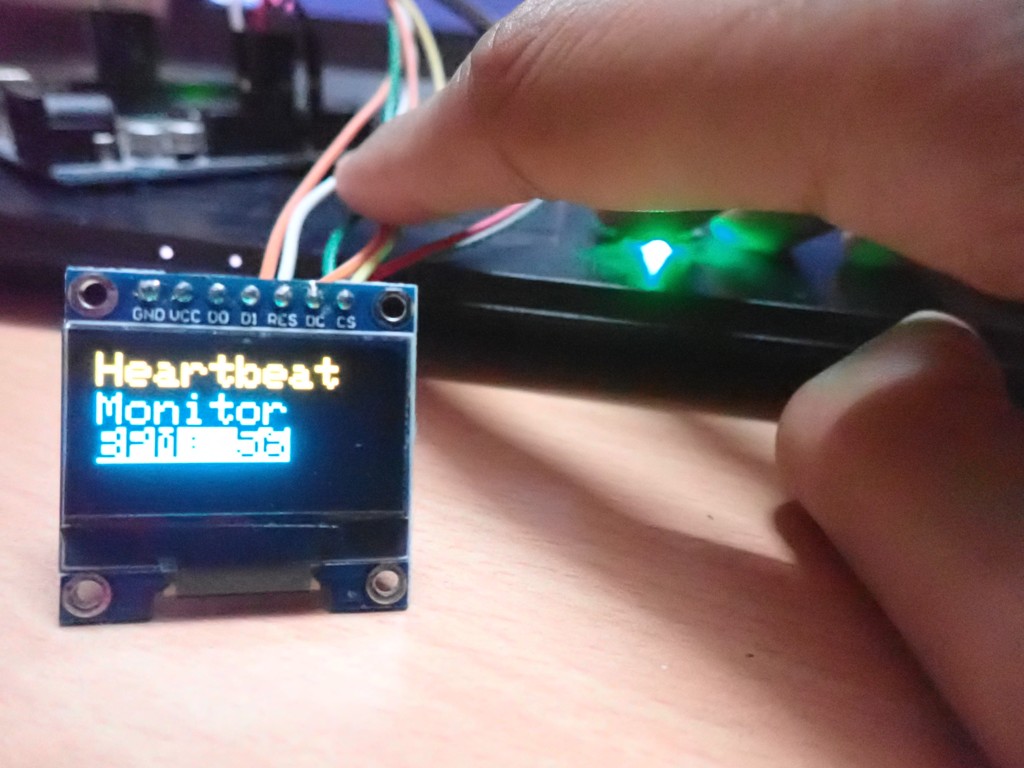
In the setup function, the baud rate for serial data transmission is set to 9600. The analog signal from the pulse sensor is read using the analogInput method. The pulse indicator LED i.e. the Arduino LED blinks using the blinkOnPulse method, and the threshold is set to 555 using the setThreshold method. The pulse sensor is initialized using the Begin method. The OLED display starts up and the “EEWORLDONLINE” logo appears on the screen.
In the loop function, the text font and color are set using the setTextSize and setTextColor methods. The pulse rate is read using the getBeatsPerMinute method and displayed on the OLED screen in the appropriate format.
Results

Heart rate monitor model 1
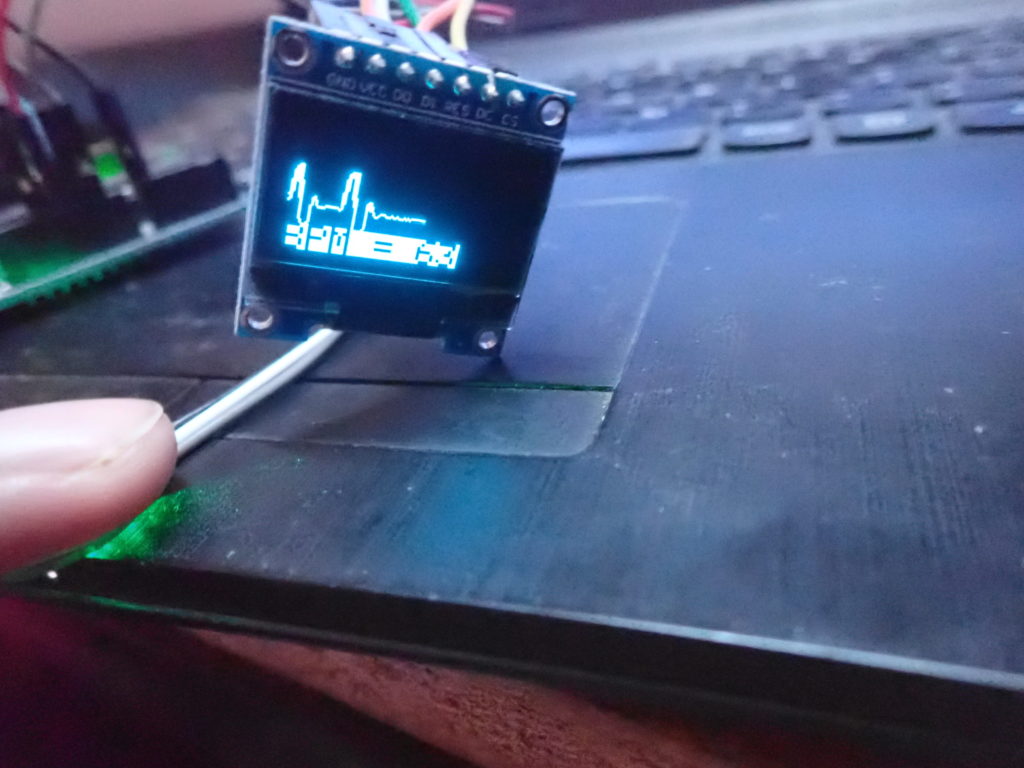
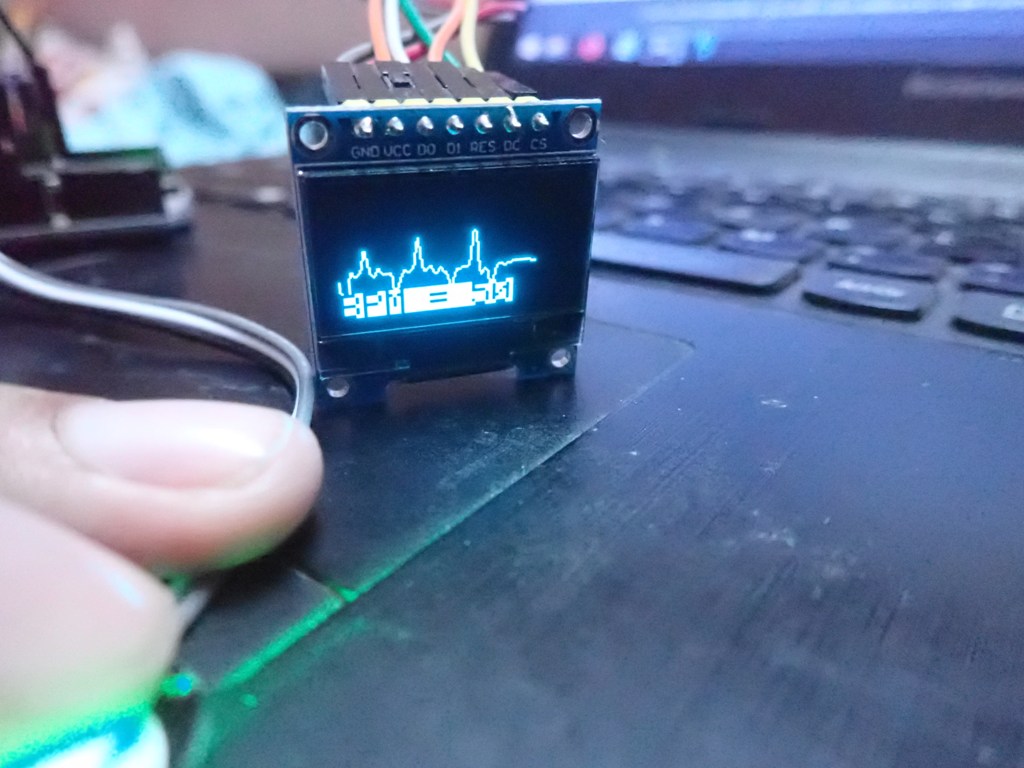
In this model, not just the pulse rate. The heart rate graph is also displayed on the OLED screen.
Required components
- Arduino UNO/any Arduino board x1
- Pulse sensor XD85C x1
- SSD1306 128×64 OLEDx1
- Jumper wires/tie wires
Circuit Connections
Same as model 1.
Arduino Sketch
How the circuit works
This model does not use the official pulse sensor library. Instead, it uses the raw analog values obtained from the pulse sensor. The sensor's raw values are compared to an upper and lower limit to detect the beginning and end of each heartbeat. The number of heartbeats is sampled over a 1-minute period using the Arduino millis method. The sensor's analog readings are mapped to the size of the SSD1306 OLED and a graph of the heart rate is plotted at the top of the screen. After each minute, the beats per second are calculated and displayed as text at the bottom of the OLED screen.
The code
The sketch starts with importing the SPI and Adafruit libraries into the SSD1306 OLED display and declaring its constants. The constants for the pulse sensor are defined. The OLED display is initialized and the bitmap that stores the icon for “EEWORLDONLINE” is set to PROGMEM. The bitmap is converted to an array. The variables for mapping the pulse waveform are declared below.
This includes declaring the upper and lower limit. In the setup function, the pulse indicator LED on the Arduino board is defined as output. The OLED display starts up and the “EEWORLDONLINE” logo flashes on it. The screen is cleared and the font size is set to 2.
In the loop function, we first test that the value of x for the graph's vertical number line does not exceed 127, as the OLED display is 128 pixels wide. The current elapsed time is stored in the variable “ThisTime” and the analog reading is obtained from pin A0. The signal value is stored as a variable mapping the signal value to the height of the OLED display. Note that the analog value range, i.e. 1024, is divided by 64 to get 16. The signal value is divided by 16 to scale it to the resolution of the OLED display. The signal value is compared to the upper limit to determine whether the beat was detected. The signal value is compared to the lower limit to determine beat completion. BPM is detected every 1 minute and displayed as text at the bottom of the OLED display.
Result