Hacking the EEG signal
In this first experiment, we will try to hack the EEG signals. To do this, we need to take some steps so that we can easily measure the signals.
To do this, I drilled a hole in the EEG sensor cover as shown in the image shared below.
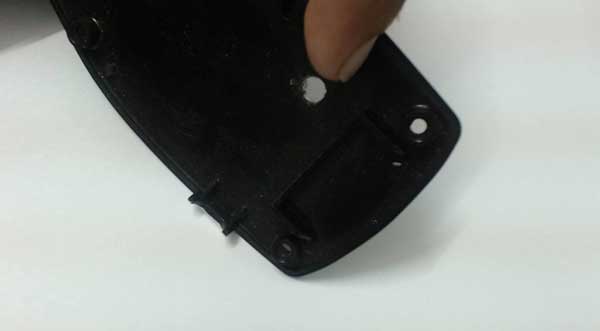
Fig. 1: Image of the plastic box for the Brainwave module
Now after drilling the hole, the next task is to solder some wires to the desired pin so that we can measure the signals. I soldered two wires for our measurement. One is on the EEG electrode pin and the other is on the reference electrode pin.
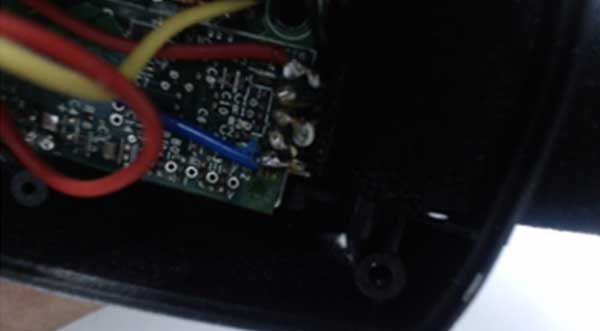
Fig. 2: Brainwave Module Circuit Image
I hope you can clearly see that there are two wires soldered here. One is red and one is blue. The red wire is soldered to the EEG electrode pin and the Blue wire is soldered to the Ref electrode pin. You can take a look again at the previous article where the pin description was explained.
While soldering, make sure that the wire does not touch the adjacent pin as this may damage the device. Also, as can be seen in the image, there is very little space available to solder the wire, so be aware of the precautions. I wound the wires together so that any magnetic effect can be nullified as much as possible. I also tied a note of the wires to the sensor so that any tension on the wire (outside the box) does not affect the soldered pin and they stay securely connected for a long time. After that I closed the sensor and in the end there were two wires coming out of it as shown in the photo below:
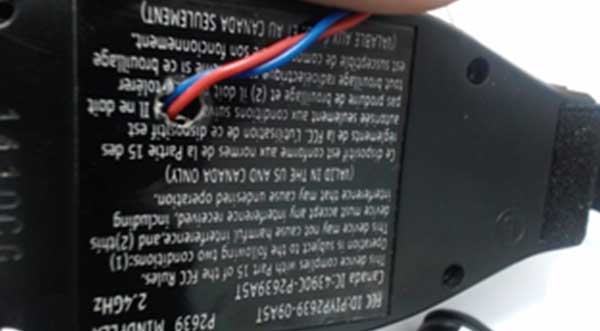
Fig. 3: Image of the power supply wires on the Brainwave module
Now we can connect these two wires to the CRO and measure the signals. Now it's time to check the CRO signals. I used the brainwave sensor and connected two wires from the sensor to the oscilloscope. I also removed the charger from my laptop so there is no chance of floating or any other spikes on the ground.
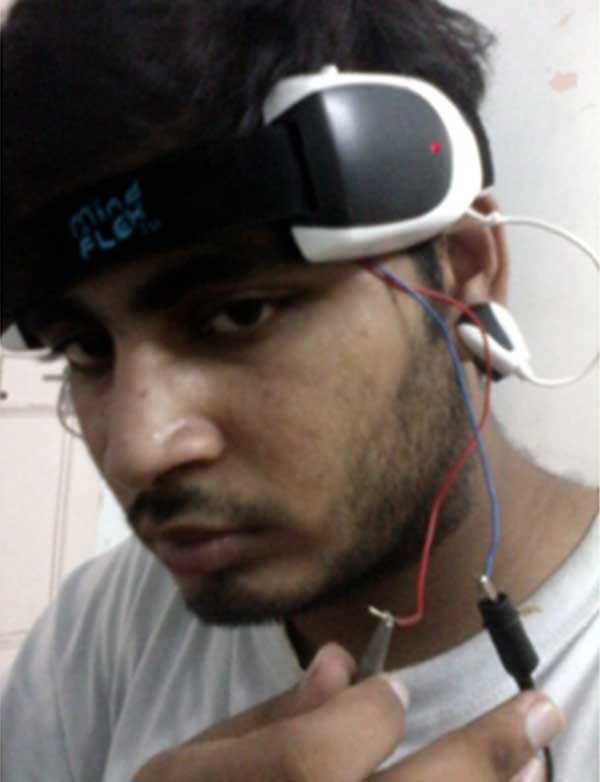
Fig. 4: Image of the lid constructed using the Brainwave module
After turning on the sensor, the wave I receive is shown in the figure below. Keep guessing what I was thinking at that moment!!
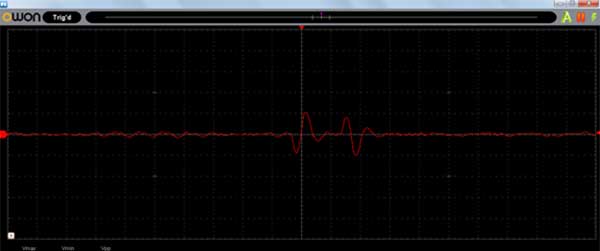
Fig. 5: Image of the EEG graph in CRO
We finally got to a point where we could see our BrainWave directly on the screen. Now it's a matter of discussion about the wave, its various curves and values. Currently, we obtained a wave with a maximum voltage of almost 65 mV and a minimum of -10 mV. EEG Signal Study.
We have successfully received and recorded the Brainwave signal or you can say the signal coming from the electrodes of the TGAM1 chip. Now let's take a focused and detailed look at the signal and try to analyze it.
As I discussed earlier, there are mainly 5 types of brain waves. We all try to find all these brain waves in this signal. Please note that these are just my assumptions and therefore I could be wrong.
First we will look at Delta waves. Now, the characteristic of Delta waves is that they are of very low frequency and have the highest amplitude. Can you find any wave in the image with lower frequency and higher amplitude? Low frequency means that the wave has a longer time period and should appear for much less time on the chart. There is one of these high crests on the chart and it only appears once. So my assumptions say these waves are Delta waves.
Now come theta waves, the frequency of these waves is higher than Delta, but still very low and their amplitude is also very low. So please take a look at the crest that I consider Theta waves. They are low in both frequency and amplitude. After Delta and theta, it's time for alpha waves. The frequency of Alpha waves varies close to 10 – 13 Hz with greater amplitude, but not as high as delta waves. Not from the frequency, but from the second largest amplitude, I guessed the alpha waves.
Similarly for beta and gamma waves, you can guess yourself that waves with higher frequencies are gamma waves and waves that vary in frequency between gamma and alpha are beta waves.
This is just my analysis of the wave I captured. Now we will try to experiment more with this wave and try to do certain things that are done by the TGAM1 chip.
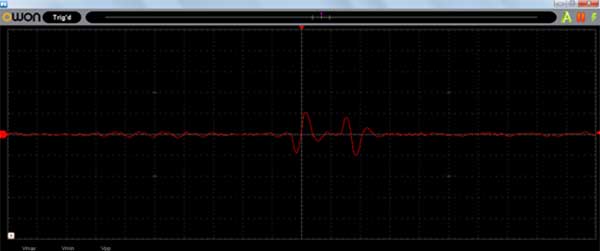
Fig. 6: Image of the EEG graph in CRO
Interfacing with transmitter pin
Let's now hack the signals that this TGAM1 chip is transmitting to the mindlflex board. The procedure is practically the same and we solder one pin to the “T” pin of the transmitter and another to the ground pin of the headband circuit. I hope you can clearly see the red wire soldered to the T pin.
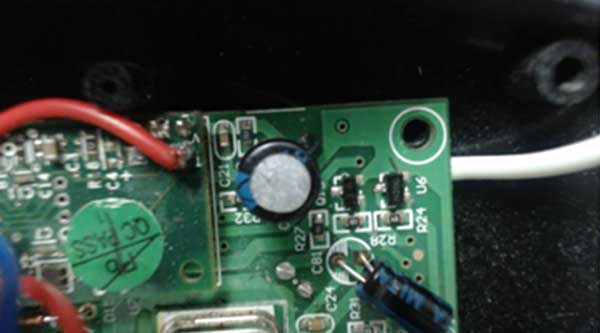
Fig. 7: Image of the brainwave module transmitter pin
In the same way as before, we took out these two wires, the red one (Transmitter) and the yellow one (Ground) also from the sensor box and now you can see four wires coming out of it. These two wires are also wrapped around each other.
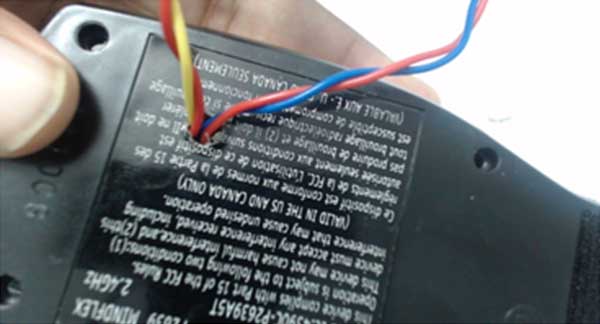
Fig. 8: Image of the transmitter and ground wires of the Brainwave module
Now, after successfully soldering and pulling these two wires out of the box, I have connected the CRO pins to these wires. Please take a look at the CRO output.
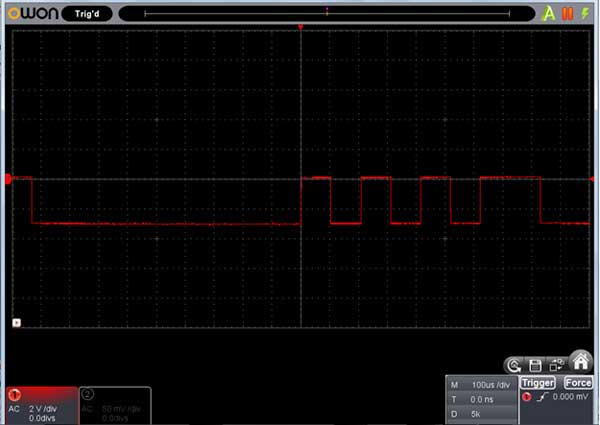
Fig. 9: Image showing the CRO output of the Brainwave module
What are these signs? Can you guess?
Well, these are some bits that the EEG module is serially transferring to the MindFlex sensor. We just hacked the pin and are now seeing the result on the screen.
Also, notice that the voltage is 3.3 V. This means that the Mindflex and TGAM1 chip communication is 3.3 V serially and I also observed that this communication is continuous as I observed the bits coming out of the pin continuously. At this stage we can say that TGAM1 is sending 3.3V serial bits. Now our next task is to read the bits and figure out how they are related to brain waves. There may be some algorithm between the two cards. It is also possible that these two boards are congratulating each other. So far we can only confirm that the sensor is transmitting some values continuously. In the next articles we will use a Serial3.3 V to Serial 5 V and then we will try to read these bits in the hyperterminal. Are you excited about what these bits will be? Will we be able to hack this toy using these pins? I'm not sure of anything right now either, but we will, after a few articles.
Brain Wave vs Body Wave
Let's see what else we can do and try it out. I always wonder if the brain is emitting some kind of wave, so does our body also emit some kind of wave or is it just our brain? Let's see what the answer is.
So, for the experiment, I soldered the EEG PIN and the ground pin with two wires. With the help of a hole I removed these two wires and connected them to the CRO pins. Let's take a look at the CRO screen when I will connect the electrode to the finger and brain.
First I connect my EEG pin to my finger and leave the reference pin in the air. I left the reference pin in the air because I just want to measure the signals my body is giving off versus the signals lost in the air. By making air the reference, I hope to have emitted the lost signals that would have reached my EEG pin. Please take a look at this.
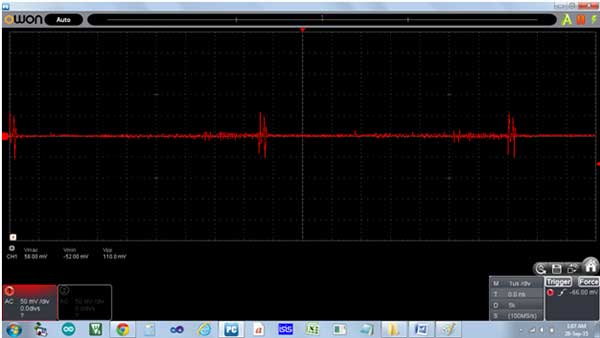
Fig. 10: Image of lost signals in CRO
The line is very straight. It can be said that the finger is not emitting any signal. In the image above, the time per division is 500ns. This means that also with this variation there is an insignificant change in the EEG graph.
Now let's take a look at the same EEG graph when the sensor electrode is connected to the forehead just above the right eye.
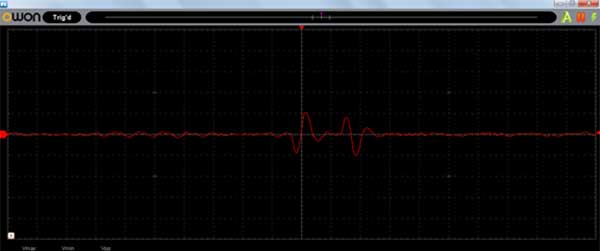
Fig. 11: Image of the EEG graph in CRO
A can get closer in the image shared below.
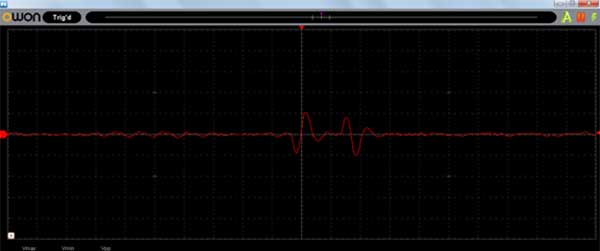
Fig. 12: Image of the EEG graph in CRO
Small and few high amplitude waves can be seen easily.
When carrying out this experiment, I noticed a very important point that could be crucial for you too.
I tested the experiment with a PC oscilloscope. Now take a look at the signs when the laptop charger is connected.
The analog values of our brain waves are of very small voltage, in the range of 15mv to 50mv. When measuring their values, we need to consider the extra magnetic field present in the environment. We also need to be careful that any stray fields in the environment can be present in our measurement. Furthermore, any soldering point or any open point can act as an antenna. We must have proper reference, grounding, and isolation when measuring brain wave values.
I hope now you have a basic idea what are the basic problems that arise while dealing with brain waves or you can say that such problems are present while measuring any wave with such small voltage. Stay tuned for the next article on EEG chip amplification and interfacing with Arduino.

