The process of resolving bugs or defects that interfere with the proper functioning of a computer software or operating system is known as Debugging. This article covers the configuration and use of a JTAG debugger with an ARM Cortex M3 microcontroller. To configure the ARM cortex M3 development environment, see this article.
The LPC 1768 is an ARM Cortex-M3-based microcontroller for embedded application capabilities with low power consumption and a high level of integration. The ARM Cortex M3 is designed in a way to enhance debugging capabilities and a higher level of system integration. It runs at a CPU frequency of 100 MHz and incorporates a 3-stage pipeline and uses a Harvard architecture with separate local instruction and data buses for third-bus peripherals. The ARM Cortex-M3 CPU has an internal prefetch unit to support speculative branches. Peripheral components include 512 KB flash memory, 64 KB data memory, Ethernet MAC, USB OTG, 4 UARTs, 8-channel general-purpose DMA controller, 2 SSP controllers, 10-bit DAC, quadrature encoder interface, SPI interface, 3 bus I2C interface, 2-input plus 2-output I2S bus interface, 4 general-purpose timers, ultra-low power real-time clock (RTC) with separate battery supply, and up to 70 user I/O pins General, 6-output general-purpose PWM. The LPC1768/66/65/64 are pin compatible with the 100-pin LPC236x ARM7 based series of microcontrollers.
The following components are used in this tutorial:
-
Debugger – Your choice
-
Controller/board – LPC1768/Explore Cortex M3
-
IDE/Compiler – Keil
As you know, JTAG can be used to program and debug the controller. The main use of JTAG is when you need to work on a huge list of codes. It can be used to add step and break points throughout the code. The image below shows the pin diagram of the Explore ARM Cortex M3 (LPC1768). It has a 20-pin JTAG ARM connector.
Connecting the hardware:

Fig. 1: Explore ARM Cortex M3 LPC1768 pin diagram
It should be noted that connecting the debugger to the board will not power it on. An external power adapter needs to be connected to the board. Once the hardware is configured, we can move on to the software part.
Selecting the debugger
-
Click on the Projects tab and then on “Target Options” (ATL + F7)
-
Click on the “Debug” tab
-
The default selection is “Simulator”. Change the selection to “Name of your debugger”.
-
Click “OK” to proceed

Fig. 2: Selecting the debugger
Debug options for NXP LPC1768:
Now select the Debug tab. In the right pane of the current window, you will find an option button called “Use”. From the drop-down list, select the name of the debugger you are using.

Fig. 3: Debug options for NXP LPC1768
Utilities option for the NXP LPC1768:
Click on the “Utilities” tab and you will see a window as shown below.

Fig. 4: Utilities option for the NXP LPC1768
Select the same debugger chosen in the previous window. The “Settings” button in this window will show the same options as the Debug window. It is highly recommended that the Debug and Utilities options are configured before proceeding to “Settings”.
Debug/Utility Settings Using NXP LPC1768:
Click the “Settings” key and confirm the Debug tab to get the window as shown below.

Fig. 5: Debug/Utility Settings Using NXP LPC1768
Grades:
-
The settings in the “Debugging” and “Utilities” tabs need to be configured before confirming the settings.
-
The link and destination must be present to see these options.
-
The “Stop after Bootloader” option must be chosen.
Flash download options for the NXP LPC1768:
In the “Flash Download” tab, confirm the options as shown below. If desired, select the “Reset and run” checkbox.

Fig. 6: Flash download options for the NXP LPC1768
If the space under “Programming Algorithm” is blank, select “ADD” and select a name from the list displayed below.
Debug programs:
Invoke the debugger
-
Click the Magnifier in the toolbar.

Debug enable/disable icon
-
If the MDK “EVALUATION” mode is being used, the message shown below will appear. Click “OK”.

Fig. 7: Evaluation mode dialog box
Message with MDK evaluation
3.The Debugger will perform the following steps:
. Turn off the flash
. Download the code
. Reset the microcontroller and execute the address Reset_Handler or “main” depending on the options that were defined in the configuration. A possible window log will be shown below:

Fig. 8: Command log when invoking the debugger
Command log when invoking debugger
4.Then the debug screen will appear.

Debugger run options

Fig. 10: Debugger execution options
Debugger run options
There are 7 execution options:
-
Reset microcontroller
-
Run the microcontroller normally
-
Stop debugging
-
Single step, one instruction at a time
-
Skip functions
-
Exit functions
-
Run to the cursor
A typical debugging session might consist of the following steps:
-
Enter Debug mode – the debugger will run at address Reset_Handler (or “main” if selected in configuration)
-
Click the cursor on a line of source code to start the investigation
-
Click on the 7th option to run the program at the cursor. All registry changes will be highlighted.
-
Click the Center icon to run the code in one step as needed.
-
If the single step enters a loop, use the 6th key to exit this function.
-
If further investigation is not necessary, use the second key to run at full speed.
-
To stop, use the 3rd key.
-
To restart the entire sequence, use the first key
-
To exit the debug session, select the magnifying glass which is present on the main toolbar.
Breakpoints

Fig. 11: Breakpoint icons
There are 4 breakpoint icons:
-
Place a breakpoint at the current cursor position. This will be shown as a red dot.
-
A running program will stop at the breakpoint
-
If the breakpoint is in a loop restarting the program, it will stop at the breakpoint on the next pass.
-
Toggle: Disable/re-enable a breakpoint on the cursor. Disabled breakpoints will be represented as an open circle.
-
Disable all breakpoints: they will be represented as open circles. They can be reactivated individually.
-
Delete all breakpoints: All breakpoint positions will be removed.
Observation window
Various windows can be activated or deactivated using toolbar icons.
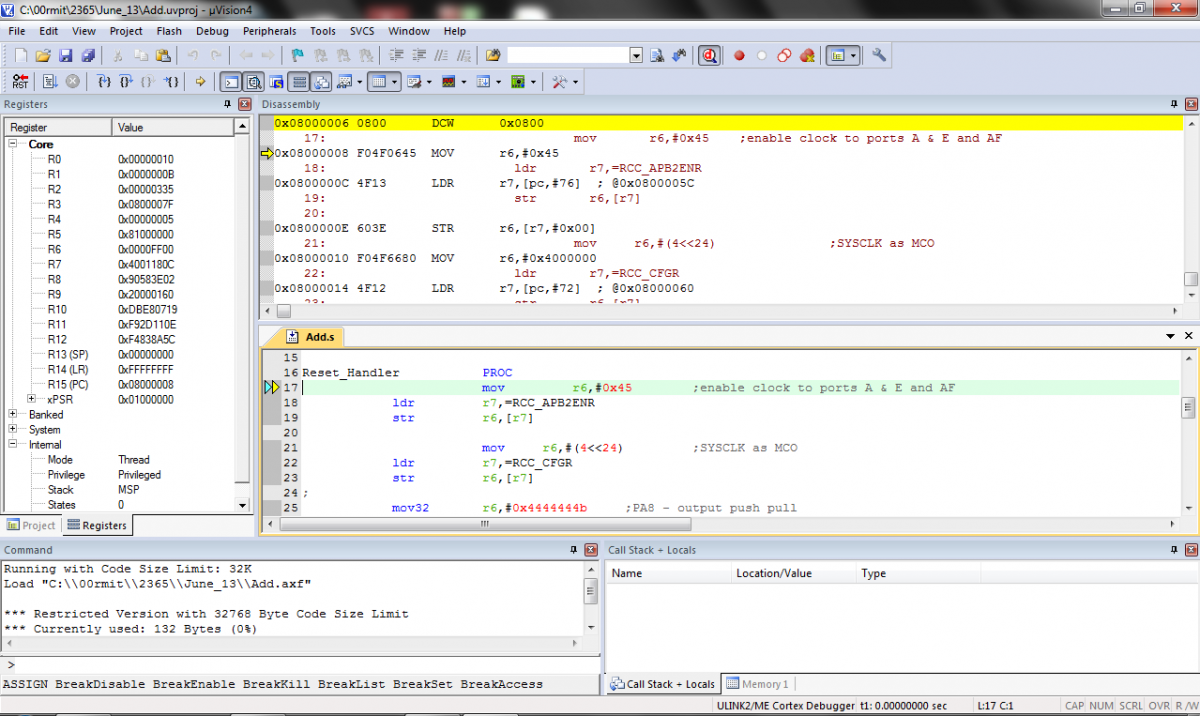
Fig. 12: Options for debugger in Windows
Windows display options for the debugger
The windows that can be enabled or disabled are:
-
Command window. (Shown by default)
-
Disassembly window. (Shown by default)
-
Symbols window (hidden by default)
-
Registration window (displayed by default)
-
Call stack window (displayed by default)
-
Observation windows (hidden by default)
-
Memory windows (shown by default)
Grades:
-
When Call Stack, Memory, and Observation are enabled, they will appear in the bottom right pane.
-
When selected, the symbols window will appear as shown below:

Fig. 13: Symbols Window
Circuit diagrams
| JTAG-Debug-With-LPC1768 | 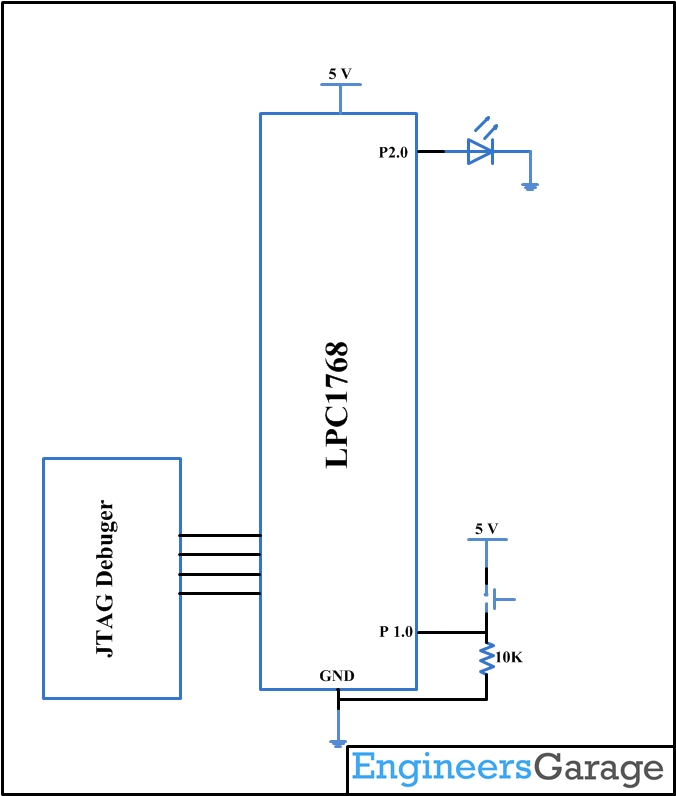 |