Hyperterminal – Analyzing Values of Different Wave Types
SUMMARY
In this brainwave series so far, we have seen few real-time applications in Brain Wave such as controlling servo motor . I'm currently planning to analyze the values of different types of waves. So I'm thinking about just showing the values on the Arduino serial monitor. I just connected the Arduino to my computer and trying to see the values on the screen.
DESCRIPTION
Now the Mindflex sensor serially sends the power FFT values of all the different wave types. So, upon receiving them on the Arduino, we can send the values to the Arduino serial monitor. We just connected the Arduino to the PC and analyzed the values. First we take the values sent by Mindflex on the Arduino board and then transfer them serially to the PC. We can see the values of the different wave types in the attached image.

Fig. 1: Image showing FFT values of different brain waves
The string sequence below is:
“Signal strength, attention, meditation, delta, theta, low alpha, high alpha, low beta, high beta, low gamma, high gamma”
The signal strength limit is 0 to 200. The lower the value, the higher the signal strength. The average signal strength is in the range of 25 to 75. After that, the next two digits are attention and meditation. These values are 0 here because the signal strength is not 100%. We have already discussed this previously that we can only get the attention and meditation values when the signal strength is 100% and the numerical value coming from MindFlex is 0. The attention and meditation values are sent by and meters from the TGAM1 chip. Then there are FFT power values of different wave types. We have performed experiments using these different types of waves before.
Below is the block diagram of the connections we made.

Fig. 2: Block diagram of the brain wave analysis device
Hardware: Please find the attached circuit diagram of the connections we need to make. We take a pin from the T pin of the mindflex sensor and connect this pin to the Rx pin of our Arduino UNO. Additionally, we short-circuited the Sensor and UNO ground by a wire. Take special care when soldering anything to the Mindflex sensor, as the pins are very close to each other. After establishing the connection with the Arduino UNO, we simply connect the arduino to the PC using the USB serial cable. This can also be done using CP2102 and connecting the RX TX pin of the arduino to CP2102 RX TX respectively.
Some points to note:
The sensor typically provides 60 to 80% resistance due to its orientation and where it is located. Try to keep the metal sensor exactly above your left eye. I also applied salt water to my forehead for better connectivity with the sensor. If you don't find 100%, then it's normal. The signal strength also interferes with how we solder the wire to the T pin.
Try shielding this wire and also make sure the reference probes are connected correctly. If you have any wires connected to the sensor's EEG Pin, disconnect that wire, as this will create a lot of noise in the sensor values.
You can also try your hand at carrying out the experiment and then share your feedback with us. Stay tuned for more experiments in the series.
Project source code
###
//Program to// Brain Arduino Library - Brain SoftSerial Test
###
Circuit diagrams
| Circuit-Diagram-Analyzes-Brain-Waves-Device | 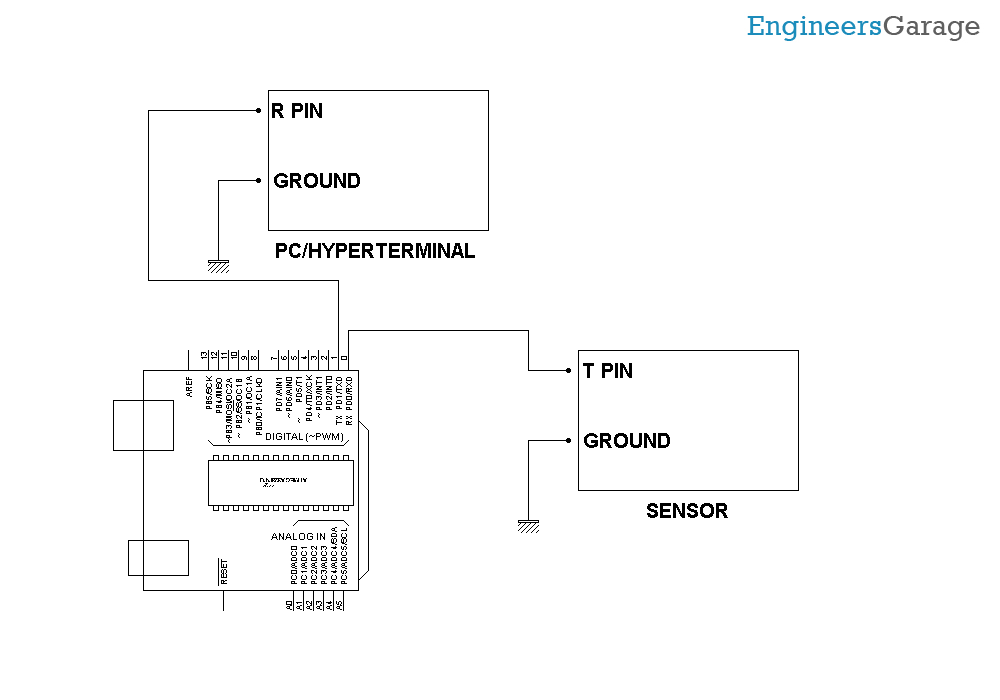 |