Accurately assessing the quality of steel structures in service requires determining the grade and strength of the steel. This is the basis for reliable testing and evaluation.
The conventional method for determining the strength of steel is to extract samples from the structure for tensile testing, but this approach can cause damage to the original structure and may not be viable for certain structures.
Therefore, it is crucial to use non-destructive testing methods to calculate the grade and strength of steel.
National and international researchers have investigated non-destructive testing methods to determine the strength of steel on engineering sites. They mainly focused on chemical composition and hardness and developed some empirical formulas.
Related reading: Metal Hardness: The Ultimate Guide (with Hardness Chart)
These empirical formulas can be categorized into two types:
The first type involves calculating tensile strength based on chemical composition, as specified in the formula of Technical Standard GB/T 50621-2010 for In-Site Testing of Steel Structures. However, the strength of steel materials is affected by chemical composition and manufacturing process (such as casting, forging, rolling, and heat treatment), so relying solely on chemical composition to calculate steel strength may result in significant deviation.
The second type involves calculating tensile strength based on hardness. Research has shown that there is a positive correlation between the hardness and tensile strength of steel. The tensile strength of materials can be estimated from the results of hardness tests, which is a widely used method in engineering practice.
Currently, the main national standards that can be used for this purpose are GB/T 33362-2016 Conversion of Hardness Values of Metallic Materials and GB/T 1172-1999 Conversion of Hardness and Strength of Ferrous Metals. GB/T 33362-2016 is equivalent to the ISO 18265:2013 conversion of hardness values of metallic materials. The hardness conversion table for non-alloy steel, low-alloy steel and cast steel in Table A.1 of this standard was obtained through comparison tests with hardness meters verified and calibrated in different laboratories by the German Association of Metallurgical Engineers. GB/T 1172-1999 was obtained through extensive testing and research by institutions such as the Chinese Academy of Metrology. Table 2 of the standard mainly provides the conversion ratio applicable to low-carbon steel.
However, none of these standards provide reliable data with statistical significance for the uncertainty of conversion values, and the range of deviation of conversion results is unknown. The researchers studied the correlation between hardness and strength of steel used in the construction of steel structures using regression analysis and compared it with national standards, which serve as a verification and complement to standards GB/T 33362-2016 and GB/ T 1172-1999. They also discussed the detection method suitable for steel structure project sites by incorporating existing portable detection instruments.
1. Test sample
The research objects of this study are Q235 and Q345 steel plates commonly used in metal structure engineering.
Related Reading : Q235 vs Q345 Steel
In order to ensure representative samples, 162 steel plates were collected from 86 steel structure manufacturers in Jiangsu Province, comprising 82 pieces of Q235 steel plates and 80 pieces of Q345 steel plates. The thickness specifications of the steel plates were 6, 8, 10, 12, 14, 18, 20 and 30 mm.
The steel plates were processed into 20mm x 400mm strip samples and tensile tests were carried out using a microcomputer-controlled servo electro-hydraulic tensile testing machine in accordance with the requirements of GB/T 228.1-2010 .
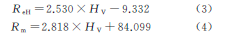
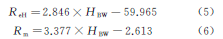
The test results of superior yield strength and tensile strength of Q235 and Q345 steel plates were statistically analyzed, and the distribution frequency is shown in Figure 1.
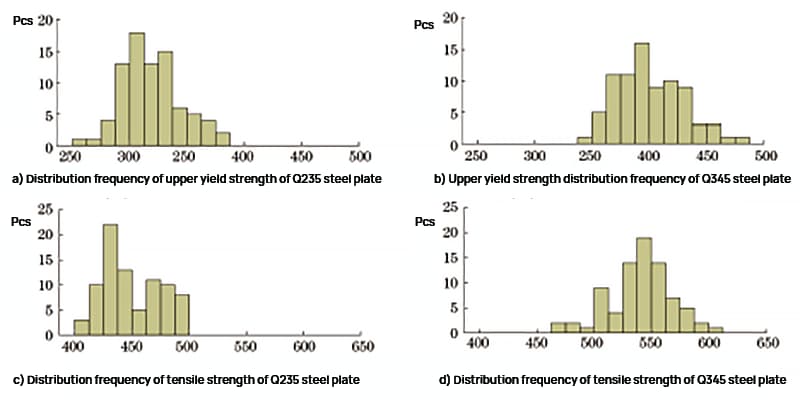
Fig. 1 Resistance distribution frequency of Q235 steel plate and Q345 steel plate
As shown in Figure 1, the upper yield strength range of Q235 steel plate is 261 to 382 MPa, and the tensile strength range is 404 to 497 MPa. The upper yield strength range of Q345 steel plate is 345 to 477 MPa, and the tensile strength range is 473 to 607 MPa.
The intensity frequency distribution is approximately normal and the test results are in line with the daily inspection data, indicating that the samples are highly representative.
2. Test results and analysis
Test samples were collected and processed in accordance with standard requirements and subjected to Rockwell hardness, Vickers hardness, Brinell hardness and tensile testing.
To carry out the regression analysis of the results of the hardness and resistance tests, the least squares method was used and the SPSS software was used.
2.1 Correlation between Rockwell hardness and strength
2.1.1 Rockwell hardness test results and analysis
The sample surface was sanded with a grinder to ensure it was flat and smooth. Scale B was selected and the instrument was calibrated using a standard hardness block. The Rockwell hardness test was carried out in accordance with the requirements of the Rockwell hardness test of metallic materials GB/T 230.1-2018, part 1: test method. Three points were measured for each sample and the average value was obtained.
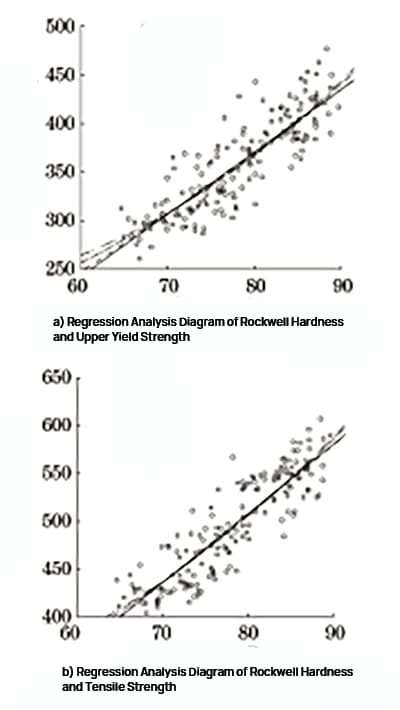
Fig. 2 Regression analysis of Rockwell hardness and strength
SPSS software was used to perform linear regression, quadratic regression, power regression and exponential regression analysis on Rockwell hardness, upper yield point and tensile strength. The regression analysis diagram is represented in Figure 2, and the regression analysis results are presented in Table 1 and Table 2.
Table 1 Data from the Rockwell hardness regression model and upper yield point
| Equation | Model summary | Model Parameter | ||||
| R 2 | F | P Significance | constant | b1 | b2 | |
| Linear quadratic exponent | 0.736 | 446,897 | 0.000 | -143,077 | 6,426 | 0.081 |
| 0.741 | 227,290 | 0.000 | 341,852 | -6,141 | ||
| 0.740 | 456,461 | 0.000 | 0.828 | 1,392 | ||
| 0.744 | 464,965 | 0.000 | 86,806 | 0.018 | ||
Table 2 Rockwell hardness and tensile strength regression model data
| Equation | Model summary | Model Parameter | ||||
| R 2 | F | P Significance | constant | b1 | b2 | |
| Linear quadratic exponent | 0.780 | 565,900 | 0.000 | -71,394 | 7,241 | 0.074 |
| 0.783 | 286,412 | 0.000 | 372,980 | -4.274 | ||
| 0.778 | 560,887 | 0.000 | 3,477 | 1,137 | ||
| 0.782 | 574,207 | 0.000 | 155,315 | 0.015 | ||
As indicated by Table 1 and Table 2, Rockwell hardness has a strong correlation with strength, and the correlation with tensile strength is stronger compared to top yield strength.
Of the four regression models between Rockwell hardness and strength, all have a significance P less than 0.05 and a goodness of fit close to R 2 .
Since the conversion relationship between Rockwell hardness and the tensile strength of low carbon steel specified in the standard is similar to the polynomial model, it is recommended to use the quadratic model for conversion.
The formula after adjustment is:
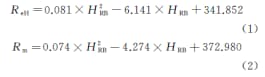
Where: R Eh is the upper yield limit; R i is the tensile strength; H RB is Rockwell hardness.
2.1.2 Relative deviation analysis of conversion results
Based on the fitted quadratic regression model, the relative deviations between the converted values of the upper yield point and tensile strength and the tensile test results were calculated and statistically analyzed. The sample size was 162 and the results are presented in Table 3.
The relative deviations follow a normal distribution, and the frequency distribution is shown in Figure 3.
Table 3 Statistical Table of Relative Deviation of Rockwell Hardness to Strength
| Statistical Items | Minimum value | Maximum | Average deviation | Standard reference |
| Relative deviation of the upper yield point conversion value | -16.56 | +16.61 | ±5.46 | 6.84 |
| Relative deviation of converted tensile strength | -1:31 p.m. | +11.16 | ±4.12 | 5.03 |
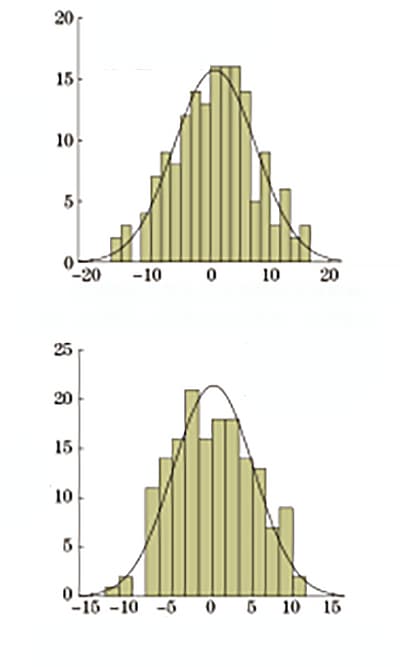
Fig. 3 Relative deviation of Rockwell hardness in relation to strength
2.1.3 Comparison with national standard conversion value
Figure 4 shows a comparison of the tensile strength conversion value specified in the standard, the fitted quadratic regression formula conversion value, and the scatterplot of the corresponding relationship between Rockwell hardness and tensile strength, all on the same graph .
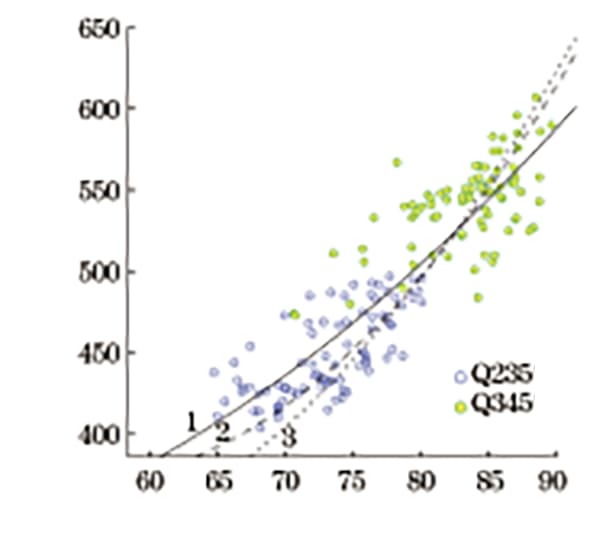
Fig. 4 Comparison chart of tensile strength converted by Rockwell hardness
As seen in Figure 4, the general trend of the three curves is consistent. The tensile strength conversion value given in GB/T 1172-1999 is similar to that of the author, with an average deviation of 2.7% and a maximum deviation of 5.7% in the range of 370 to 630 MPa.
However, the tensile strength conversion value given in GB/T 33362-2016 is lower for Q235 steel (with tensile strength in the range of 370 to 500 MPa) and higher for Q345 steel (with tensile strength in the range of range from 470 to 630 MPa).
2.2 Correlation between hardness and Vickers resistance
2.2.1 Vickers hardness testing process and results analysis
The surface of the sample was polished with a grinder and the instrument was calibrated with a standard hardness block. The Vickers hardness test was carried out in accordance with the requirements of the Vickers hardness test of metallic materials GB/T 4340.1-2009, part 1: test method. Three points were measured for each sample and the average value was obtained.
SPSS software was used to perform linear regression, quadratic regression, power regression and exponential regression analysis on Vickers hardness, upper yield point and tensile strength. The regression analysis diagram is represented in Figure 5, and the regression analysis results are presented in Table 4 and Table 5.
Table 4 Vickers hardness regression model data and upper yield point
| Equation | Model summary | Model Parameter | ||||
| R 2 | F | P Significance | constant | b1 | b2 | |
| Linear quadratic exponent | 0.727 | 426,980 | 0.000 | -9,332 | 2,530 | 0.002 |
| 0.728 | 212,272 | 0.000 | 27,358 | 2020 | ||
| 0.731 | 433,768 | 0.000 | 2,215 | 1,021 | ||
| 0.731 | 435,083 | 0.000 | 126,740 | 0.007 | ||
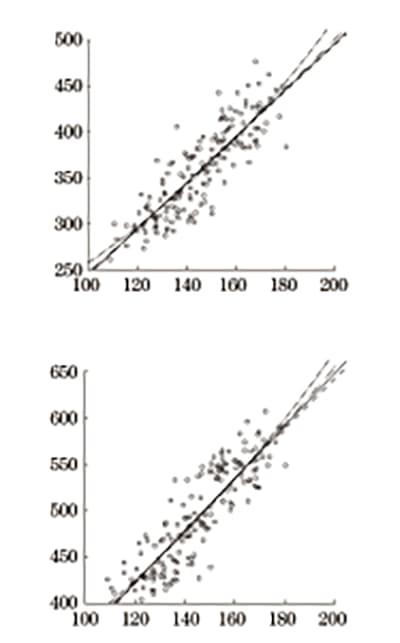
Fig. 5 Regression analysis of Vickers hardness and strength
Table 5 Vickers Hardness and Tensile Strength Regression Model Data
| Equation | Model summary | Model Parameter | ||||
| R 2 | F | P Significance | Constant | b1 | b2 | |
| Linear quadratic exponent | 0.753 | 486,507 | 0.000 | 84,099 | 2,818 | 0.002 |
| 0.753 | 241,944 | 0.000 | 133,182 | 2,136 | ||
| 0.748 | 475,262 | 0.000 | 8,189 | 0.823 | ||
| 0.751 | 483,330 | 0.000 | 213,597 | 0.006 | ||
As indicated by Table 4 and Table 5, Vickers hardness has a strong correlation with strength, and the correlation with tensile strength is stronger compared to top yield strength.
Of the four regression models between Vickers hardness and strength, all have a significance P less than 0.05 and a goodness of fit close to R 2 .
Since the conversion relationship between Vickers hardness and the tensile strength of low carbon steel specified in the standard is close to a linear relationship, it is recommended to use the linear relationship for conversion.
The formula after adjustment is:
Where: H V is the Vickers hardness.
2.2.2 Relative deviation analysis of conversion results
Based on the fitted linear regression model, the relative deviations between the converted values of the upper yield limit and tensile strength and the tensile test results were calculated and statistically analyzed. The sample size was 162 and the results are presented in Table 6.
The relative deviations follow a normal distribution, and the frequency distribution is shown in Figure 6.
Table 6 Statistical Table of Relative Deviation of Vickers Hardness for Strength
| Statistical Items | Minimum value | Maximum | Average deviation | Standard reference |
| Relative deviation of the upper yield point conversion value | -7:30 p.m. | +17.55 | ±5.75 | 7.09 |
| Relative deviation of converted tensile strength | -12:32 | +15.83 | ±4.88 | 5.44 |
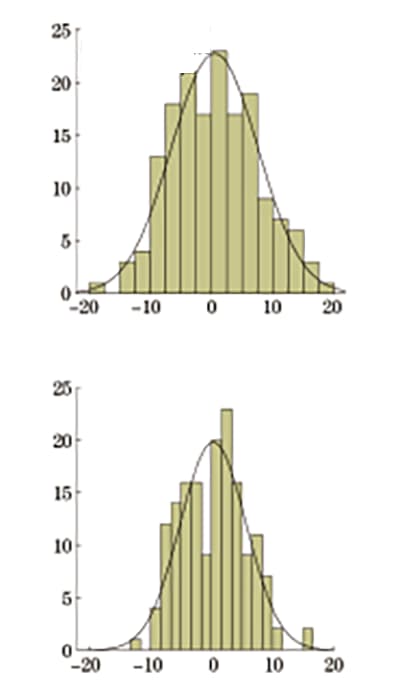
Fig. 6 Relative deviation of Vickers hardness converted into strength
2.2.3 Comparison with national standard conversion value
Figure 7 shows a comparison of the tensile strength conversion value specified in the standard, the conversion value of the linear regression formula obtained by the author and the scatterplot of the corresponding relationship between Vickers hardness and tensile strength, all on the same graph .
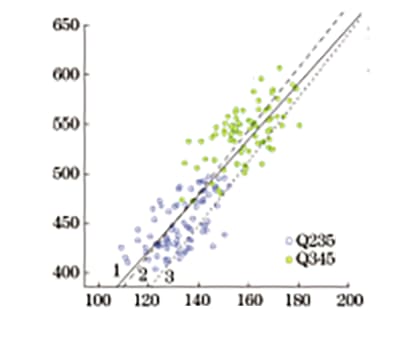
Fig. 7 Comparison chart of tensile strength converted by Vickers hardness
As seen in Figure 7, the general trend of the three curves is consistent. The tensile strength conversion value specified in GB/T 1172-1999 is very close to the conversion value obtained by the author. In the range of 370 to 630 MPa, the difference between them increases slightly with increasing hardness value, with an average deviation of 1.2% and a maximum deviation of 3.3%. However, the tensile strength conversion value given in GB/T 33362-2016 is generally lower.
2.3 Correlation between hardness and Brinell resistance
2.3.1 Brinell hardness testing process and results analysis
The surface of the sample was polished with a grinder to ensure a surface roughness of no more than 1.6 μm. The instrument was calibrated with a standard hardness block and the Brinell hardness test was performed in accordance with the requirements of GB/T 231.1-2018 Brinell hardness test of metallic materials Part 1: Test method. A carbide indenter with a diameter of 10 mm was used and the test force was 29.42 kN. Three points were measured for each sample and the average value was obtained.
SPSS software was used to perform linear regression, quadratic regression, power regression and exponential regression analysis on Brinell hardness, upper yield strength and tensile strength. The regression analysis diagram is represented in Figure 8, and the regression analysis results are presented in Table 7 and Table 8.
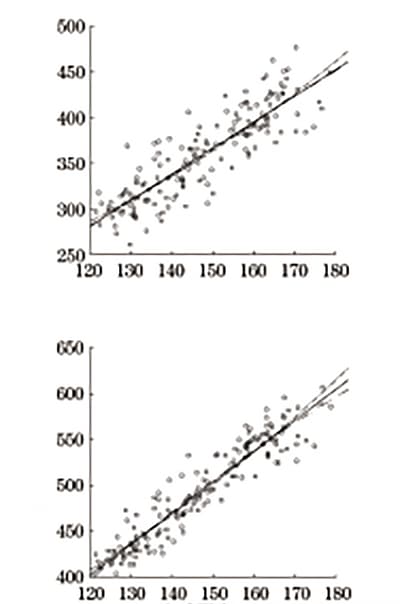
Fig. 8 Regression analysis of Brinell hardness and strength
Table 7 Data from the Brinell hardness and upper yield point regression model
| Equation | Model summary | Model Parameter | ||||
| R 2 | F | P Significance | constant | b1 | b2 | |
| Linear quadratic exponent | 0.756 | 495,403 | 0.000 | -59,965 | 2,846 | -0.001 |
| 0.758 | 246,186 | 0.000 | -86,188 | 3,205 | ||
| 0.757 | 497,365 | 0.000 | 1,048 | 1,168 | ||
| 0.756 | 494,881 | 0.000 | 110,318 | 0.008 | ||
Table 8 Brinell hardness and tensile strength regression model data
| Equation | Model summary | Model Parameter | ||||
| R 2 | F | P Significance | constant | b1 | b2 | |
| Linear quadratic exponent | 0.887 | 1253.313 | 0.000 | -2.613 | 3,377 | -0.001 |
| 0.888 | 631,852 | 0.000 | -225,666 | 6,424 | ||
| 0.889 | 1286.205 | 0.000 | 3,204 | 1,009 | ||
| 0.886 | 1238,834 | 0.000 | 179,073 | 0.007 | ||
As indicated by Table 7 and Table 8, Brinell hardness has a strong correlation with strength, and the correlation with tensile strength is stronger compared to top yield strength.
Of the four regression models between hardness and Brinell strength, all have a significance P less than 0.05 and a goodness of fit close to R 2 .
Since the conversion relationship between the Brinell hardness of carbon steel and the tensile strength specified in the standard is close to a linear relationship, it is recommended to use a linear relationship for conversion.
The adjusted formula is:
Where: H PN is Brinell hardness.
2.3.2 Relative deviation analysis of conversion results
According to the adjusted linear regression model, the relative deviations between the converted values of the upper yield strength and tensile strength and the tensile test results are calculated respectively, and the relative deviations are analyzed statistically.
The statistics are 162 and the results are shown in Table 9.
The relative deviations are basically normal distribution, and the frequency distribution is shown in Fig.
Table 9 Statistical Table of Relative Deviation of Brinell Hardness to Strength
| Statistical Items | Minimum value | Maximum | Average deviation | Standard reference |
| Relative deviation of the upper yield point conversion value | -16.78 | +18.67 | ±5.38 | 6.75 |
| Relative deviation of converted tensile strength | -9.25 | +8.55 | ±2.89 | 3.59 |
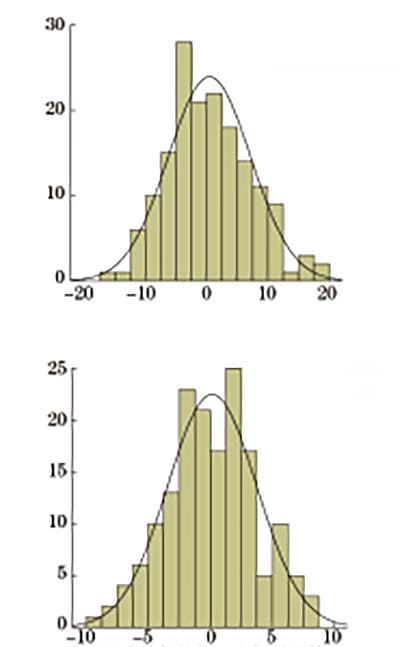
Fig. 9 Relative deviation of Brinell hardness converted into strength
2.3.3 Comparison with national standard conversion value
In GB/T 1172-1999, the relationship between the test force and the indenter ball diameter of the Brinell hardness test is 10.
Author testing is carried out in accordance with GB/T 231.1-2018. With reference to the provisions of the standard, the relationship between the test force and the diameter of the indenter ball is 30.
Therefore, it is no longer compared with GB/T 1172-1999 compared to the national standard conversion value.
The standard conversion value of tensile strength given in GB/T 33362-2016, the conversion value of the linear regression formula adjusted by the author and the scatterplot of the corresponding relationship between Brinell hardness and tensile strength are compared in same graph, as shown in Figure 10.
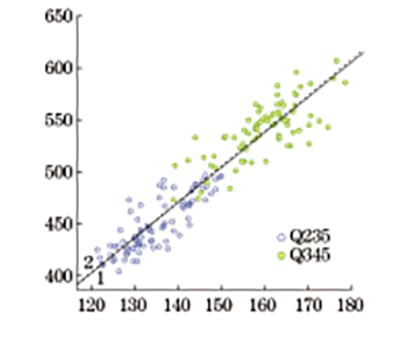
Fig. 10 Comparison chart of tensile strength converted by Brinell hardness
It can be seen from Figure 10 that the tensile strength conversion value given in GB/T 33362-2016 almost coincides with the tensile strength regression curve adjusted by the author, with an average deviation of 0.4% and a maximum deviation of 1.2% within 370-630MPa.
In recent years, the rapid development of various portable hardness testers has brought great convenience to on-site testing.
At present, many types of portable Rockwell hardness tester and portable Brinell hardness tester can be purchased on the market.
The equipment is portable, simple to operate, quick to measure, and the detection accuracy also meets the requirements of national standards, which is suitable for on-site engineering detection.
There are also various portable processing equipment for sample surface treatment, which can meet testing requirements.
Therefore, it is feasible to use Rockwell hardness and Brinell hardness to calculate the strength of steel in field inspection of steel structures.
3. Conversion of hardness to strength for ferrous metals (GB/T 1172-1999)
| Toughness | Tensile strength σb /MPa |
||||||||||||||||
| Rockwell | Rockwell Surface | Vickers | Brinell | Carbon steel | Chrome steel | Barium chrome steel | Nickel chrome steel | Chrome molybdenum steel | Chrome Nickel Molybdenum Steel | Chrome-manganese-silicon steel | Ultra-high strength steel | Stainless steel | No specific type of steel specified | ||||
| CDH | HR | HR15N | HR30N | HR45N | High voltage | HB30D 2 |
d 10. 2 d 5. 4 d 2.5 /mm |
||||||||||
| 17 | – | 67.3 | 37.9 | 15.6 | 211 | 211 | 4.15 | 73.6 | 706 | 705 | 772 | 726 | – | 757 | – | 703 | 724 |
| 18 | – | 67.8 | 38.9 | 16.8 | 216 | 216 | 4.11 | 753 | 723 | 719 | 779 | 737 | – | 769 | – | 719 | 737 |
| 19 | – | 68.3 | 39.8 | 18 | 221 | 220 | 4.07 | 771 | 739 | 735 | 788 | 749 | – | 782 | – | 737 | 752 |
| 20 | – | 68.8 | 40.7 | 19.2 | 226 | 225 | 4.03 | 790 | 757 | 751 | 797 | 761 | – | 796 | – | 754 | 767 |
| 21 | – | 69.3 | 41.7 | 20.4 | 231 | 227 | 4 | 809 | 775 | 767 | 807 | 775 | – | 810 | – | 773 | 782 |
| 22 | – | 69.8 | 42.6 | 21.5 | 237 | 234 | 3.95 | 829 | 794 | 785 | 819 | 789 | – | 825 | – | 792 | 799 |
| 23 | – | 70.3 | 43.6 | 22.7 | 243 | 240 | 3.91 | 849 | 814 | 803 | 831 | 805 | – | 840 | – | 812 | 816 |
| 24 | – | 70.8 | 44.5 | 23.9 | 249 | 245 | 3.87 | 870 | 834 | 823 | 845 | 821 | – | 856 | – | 832 | 835 |
| 25 | – | 71.4 | 45.5 | 25.1 | 255 | 251 | 3.83 | 892 | 855 | 843 | 860 | 838 | – | 874 | – | 853 | 854 |
| 26 | – | 71.9 | 46.4 | 26.3 | 261 | 257 | 3.78 | 914 | 876 | 864 | 876 | 857 | 876 | 892 | – | 875 | 874 |
| 27 | – | 72.4 | 47.3 | 27.5 | 268 | 263 | 3.74 | 937 | 898 | 886 | 893 | 877 | 897 | 910 | – | 897 | 895 |
| 28 | – | 73 | 48.3 | 28.7 | 274 | 269 | 3.7 | 961 | 920 | 909 | 912 | 897 | 918 | 930 | – | 919 | 917 |
| 29 | – | 73.5 | 49.2 | 29.9 | 281 | 276 | 3.65 | 984 | 943 | 933 | 932 | 919 | 941 | 951 | – | 942 | 940 |
| 30 | – | 74.1 | 50.2 | 31.1 | 289 | 283 | 3.61 | 1009 | 967 | 959 | 953 | 943 | 966 | 973 | – | 966 | 904 |
| 31 | – | 74.7 | 51.1 | 32.3 | 296 | 291 | 3.56 | 1034 | 991 | 985 | 976 | 967 | 991 | 996 | – | 990 | 989 |
| 32 | – | 75.2 | 52 | 33.5 | 304 | 298 | 3.52 | 1060 | 1016 | 1013 | 1001 | 993 | 1018 | 1020 | – | 1015 | 1015 |
| 33 | – | 75.8 | 53 | 34.7 | 312 | 306 | 3.48 | 1086 | 1042 | 1042 | 1027 | 1020 | 1047 | 1046 | – | 1041 | 1042 |
| 34 | – | 76.4 | 53.9 | 25.9 | 320 | 314 | 3.43 | 1113 | 1068 | 1072 | 1054 | 1049 | 1077 | 1073 | – | 1067 | 1070 |
| 35 | – | 77 | 54.8 | 37 | 329 | 323 | 3.39 | 1141 | 1095 | 1104 | 1084 | 1079 | 1108 | 1101 | – | 1095 | 1100 |
| 36 | – | 77.5 | 55.8 | 38.2 | 338 | 332 | 3.34 | 1170 | 1124 | 1136 | 1115 | 1111 | 1141 | 1130 | – | 1126 | 1131 |
| 37 | – | 78.1 | 56.7 | 39.4 | 347 | 341 | 3.3 | 1200 | 1153 | 1171 | 1148 | 1144 | 1176 | 1161 | – | 1153 | 1163 |
| 38 | – | 78.7 | 57.6 | 40.6 | 357 | 350 | 3.26 | 1231 | 1184 | 1206 | 1132 | 1179 | 1212 | 1194 | – | 1184 | 1197 |
| 39 | 70 | 79.3 | 58.6 | 41.8 | 367 | 360 | 3.21 | 1263 | 1216 | 1243 | 1219 | 1216 | 1250 | 1228 | 1218 | 1216 | 1232 |
| 40 | 70.5 | 79.9 | 59.5 | 43 | 377 | 370 | 3.17 | 1296 | 1249 | 1282 | 1257 | 1254 | 1290 | 1264 | 1267 | 1250 | 1268 |
| 41 | 71.1 | 80.5 | 60.4 | 44.2 | 388 | 380 | 3.13 | 1331 | 1284 | 1322 | 1298 | 1294 | 1331 | 1302 | 1315 | 1286 | 1307 |
| 42 | 71.6 | 81.1 | 61.3 | 45.4 | 399 | 391 | 3.09 | 1367 | 1322 | 1364 | 1340 | 1336 | 1375 | 1342 | 1362 | 1325 | 1347 |
| 43 | 72.1 | 81.7 | 62.3 | 46.5 | 411 | 401 | 3.05 | 1405 | 1361 | 1407 | 1385 | 1379 | 1420 | 1384 | 1409 | 1366 | 1389 |
| 44 | 72.6 | 82.3 | 63.2 | 47.7 | 423 | 413 | 3.01 | 1445 | 1403 | 1452 | 1431 | 1425 | 1467 | 1427 | 1455 | 1410 | 1434 |
| 45 | 73.2 | 82.9 | 64.1 | 48.9 | 436 | 424 | 2.97 | 1488 | 1448 | 1498 | 1480 | 1472 | 1516 | 1474 | 1502 | 1457 | 1480 |
| 46 | 73.7 | 83.5 | 65 | 50.1 | 449 | 436 | 2.93 | 1533 | 1497 | 1547 | 1531 | 1522 | 1567 | 1522 | 1550 | 1508 | 1529 |
| 47 | 74.2 | 84 | 65.9 | 51.2 | 462 | 449 | 2.89 | 1581 | 1549 | 1597 | 1584 | 1573 | 1620 | 1573 | 1600 | 1563 | 1581 |
| 48 | 74.7 | 84.6 | 66.8 | 52.4 | 478 | 401 | 2.85 | 1631 | 1605 | 1649 | 1640 | 1626 | 1676 | 1627 | 1652 | 1623 | 1635 |
| 49 | 75.3 | 85.2 | 67.7 | 53.6 | 493 | 474 | 2.81 | 1686 | 1666 | 1702 | 1698 | 1682 | 1733 | 1683 | 1707 | 1688 | 1692 |
| 50 | 75.8 | 85.7 | 68.6 | 54.7 | 509 | 488 | 2.77 | 1744 | 1731 | 1758 | 1758 | 1739 | 1793 | 1742 | 1765 | 1759 | 1753 |
| 51 | 76.3 | 86.3 | 69.5 | 55.9 | 525 | 501 | 2.73 | – | 1803 | 1816 | 1821 | 1799 | 1854 | 1804 | 1827 | – | 1817 |
| 52 | 76.9 | 86.8 | 70.4 | 57.1 | 543 | – | – | – | 1881 | 1875 | 1887 | 1861 | 1918 | 1870 | 1894 | – | 1885 |
| 53 | 77.4 | 87.4 | 71.3 | 58.2 | 561 | – | – | – | – | 1937 | 1955 | 1925 | 1985 | 1938 | 1967 | – | 1957 |
| 54 | 77.9 | 87.9 | 72.2 | 59.4 | 579 | – | – | – | – | 2000 | 2025 | – | – | 2010 | 2045 | – | 2034 |
| 55 | 78.5 | 88.4 | 73.1 | 60.5 | 599 | – | – | – | – | 2066 | 2098 | – | – | 2086 | 2131 | – | 2115 |
| 56 | 79 | 88.9 | 73.9 | 61.7 | 620 | – | – | – | – | – | – | – | – | – | 2224 | – | 2201 |
| 57 | 79.5 | 89.4 | 74.8 | 62.8 | 642 | – | – | – | – | – | – | – | – | – | 2324 | – | 2293 |
| 58 | 80.1 | 89.8 | 75.6 | 63.9 | 664 | – | – | – | – | – | – | – | – | – | 2437 | – | 2391 |
| 59 | 80.6 | 90.2 | 76.5 | 65.1 | 688 | – | – | – | – | – | – | – | – | – | 2558 | – | 2496 |
| 60 | 81.2 | 90.6 | 77.3 | 66.2 | 713 | – | – | – | – | – | – | – | – | – | 2691 | – | 2607 |
| 61 | 81.7 | 91 | 78.1 | 67.3 | 739 | – | – | – | – | – | – | – | – | – | – | – | – |
| 62 | 82.2 | 91.4 | 79 | 68.4 | 766 | – | – | – | – | – | – | – | – | – | – | – | – |
| 63 | 82.8 | 91.7 | 79.8 | 69.5 | 795 | – | – | – | – | – | – | – | – | – | – | – | – |
| 64 | 83.3 | 91.9 | 80.6 | 70.6 | 825 | – | – | – | – | – | – | – | – | – | – | – | – |
| 65 | 83.9 | 92.2 | 81.3 | 71.7 | 856 | – | – | – | – | – | – | – | – | – | – | – | – |
| 66 | 84.4 | – | – | – | 889 | – | – | – | – | – | – | – | – | – | – | – | – |
| 67 | 85 | – | – | – | 923 | – | – | – | – | – | – | – | – | – | – | – | – |
| 68 | 85.5 | – | – | – | 959 | – | – | – | – | – | – | – | – | – | – | – | – |
| 69 | 86.1 | – | – | – | 997 | – | – | – | – | – | – | – | – | – | – | – | – |
| 70 | 86.6 | – | – | – | 1037 | – | – | – | – | – | – | – | – | – | – | – | – |
3. Conclusion
(1) Rockwell hardness, Vickers hardness and Brinell hardness have good correlation with strength. Based on the material test, the conversion formula of Rockwell hardness, Vickers hardness and Brinell hardness and strength is obtained, and the relative conversion deviation is within the design allowable range.
The relative deviation between Brinell hardness and tensile strength is obviously smaller than that of Rockwell hardness and Vickers hardness.
(2) The tensile strength converted from Rockwell hardness given in GB/T 33362-2016 is low for Q235 steel and high for Q345 steel.
The tensile strength converted from Vickers hardness is slightly lower.
The tensile strength converted from Brinell hardness is consistent with the test results.
The tensile strength values converted by Rockwell hardness and Vickers hardness given in GB/T 1172-1999 are close to the test results.
(3) Combined with existing portable hardness testing instruments and sample processing equipment, the use of Rockwell hardness and Brinell hardness to calculate the strength of steel is operable in practical projects and can be applied to engineering practice.