Learn how to debug Node.js applications quickly and easily with this comprehensive guide. Make the most of your Node.js debugging experience!

Debugging is an integral part of the software development process. Understanding their strategies and complexities is not only essential, but also forms the core of all development efforts. In the context of offering Node JS development services, there are several debugging strategies available while building NodeJs applications.
In this tutorial, we will discuss these methodologies and explore how to debug NodeJs applications using tools such as the terminal, the built-in NodeJs debugger statement, Chrome dev tools, and Visual Studio Code.
We will start by creating a basic application with the following scenario: Our task is to build an application that fetches data from some source (we will use JSON placeholder for this) and manipulates this set of data before saving it to a JSON file in the application folder . Now, let's start by building our application as decoupled as possible for our convenience.
Building the Application
We will create a new folder named nodejs-debugging and then enter the npm init -y command inside that folder to create a package.json file. Next, we will install the Express, nodemon, axios, and cors packages by running npm i express axis cors nodemon. ExpressJS is a minimalist NodeJS framework, axios will help us fetch the data correctly, cors will ensure we don't encounter cors errors, and nodemon will watch the server while we make changes to it.
Considering that the operating system we are using is Linux, we will also enter the following commands to create some folders and an index.js: mkdir controllers data routes and touch index.js. Before starting our code, we will go to the package.json file and change it as such:
 {
  "name": "testing-tips-nodejs",
  "version": "1.0.0",
  "description": "",
  "main": "index.js",
  "scripts": {
    "test": "echo \"Error: no test specified\" && exit 1",
    "start": "node index.js",
"dev": "nodemon index.js"
 },
 "keywords": ,
 "author": "",
 "license": "ISC",
 "dependencies": {
 "axios": "^1.4.0",
 "cors": "^2.8.5",
 "express": "^4.18.2"
 }
 }
As you can see, in the scripts we have the start and dev commands that run the node process and nodemon respectively. When in development mode, we want to use nodemon for our own good. Now we will write a basic express server in the index.js file.
 const express = require("express");
 const app = express;
 const cors = require("cors");
 const routes = require("./routes/posts.js");

 const port = process.env.PORT 5000;

 app.use(cors );

 app.get(" (req, res) => {
  res.send("Hello World!");
 });

 const value = 5 - 3;

 app.use("/posts", routes);

 app.listen(port, => {
  console.log(`Example app listening at
 });
You will see that we have included some extra lines like routes, posts and a value. Our server won't work now if we run npm run dev because we don't have those routes yet. The reason we're doing it this way is to modularize our code as much as possible so that when we want to know what's where and why, we'll find a properly managed folder structure instead of a big index.js file.
Writing the controllers
Now, in our controllers directory, we will create a controllers.js file and add the following snippet inside it:
 const axios = require("axios");
 const fs = require("fs");
 const path = require("path");
 const crypto = require("crypto");

 const getPosts = async (req, res) => {
  try {
    const response = await axios.get(
      "
      { params: { _limit: 15 } }
    );

    const dataFolder = path.join(__dirname, "../data");
    const dataFile = "posts.json";

    if (!fs.existsSync(dataFolder)) {

fs.mkdirSync(dataFolder);
 }

 const postData = response.data.map((post) => {
 const rating = crypto.randomInt(1, 11); // Generate a random integer between 1 and 10, inclusive

 return {
 ...post,
 rating,
 };
 });

 fs.writeFileSync(path.join(dataFolder, dataFile), JSON.stringify(postData));

 res.status(200).json(postData);
 } catch (error) {
 res.status(404).json({
 message: error.message,
 });
 }
 };

 module.exports = {
 getPosts,
 };
Let's go over what's happening in this code.
We start by importing the necessary modules such as axios for search, fs for file system, path for path, and encryption to create a random number. So, with our asynchronous getPosts function, we are sending a get request to “ https://jsonplaceholder.typicode.com/posts ” and limiting the number of objects we will receive to 15. This jsonplaceholder is a dummy API that is very useful in development.
Next, we specify where we will create a posts.json file (data folder) and confirm that we will create the folder if it does not already exist so that we do not encounter an error due to its absence. So for every item we have, we are creating a random number between 1 and 10 inclusive. Later, using the spread operator, we are adding this new random sort key/value pair to the data we already have. To wrap things up, we tie everything together and handle the error via the catch statement.
Lastly, we export the getPosts function so that we can use it in routes.
If all goes well, we should have a data/posts.json file with 15 items inside it, which looks like:
 {
 "userId" : 1,
 "id" : 10,
 "title" : "optio molestias id quia eum" ,
"body" : "quo et expedita modi cum officia vel magni\ndoloribus qui repudiandae\nvero nisi sit\nquos veniam quod sed accusamus veritatis error" ,
 "rating" : 6
 },
 {
 "userId" : 2,
 "id" : 11,
 "title" : "et ea vero quia laudantium autem" ,
 "body" : "delectus reiciendis molestiae occaecati non minima eveniet qui voluptatibus\naccusamus in eum beatae sit\nvel qui neque voluptates ut commodi qui incidunt\nut animi commodi" ,
 "rating" : 5
 },
 {
 "userId" : 2,
 "id" : 12,
 "title" : "in quibusdam tempore odit est dolorem" ,
"body" : "itaque id aut magnam\npraesentium quia et ea odit et ea voluptas et\nsapiente quia nihil amet occaecati quia id voluptatem\nincidunt ea est distinctio odio" ,
 "rating" : 4
 },
Here the userId, id, title and body fields are returned from the API and we have added the rating field with a random number.
Now that we've written our controllers, it's time to write the routes for it so we can import it into index.js and call it via curl or a tool like Postman.
Writing the routes
Let's go to the routes directory and create a posts.js file and paste the following snippet into it:
 const express = require("express");
 const router = express.Router;

 const { getPosts } = require("../controllers/controllers.js");

 router.get(" getPosts);

 module.exports = router;
Here, by importing Express and using its router, we are creating a base route for the getPosts function that we get from controllers.js. We also export the router. Now our index.js file makes sense. If we send a get request to the data/posts.json file it will be created as specified.
Debugging via Terminal and Watchers
Now that we have a working project ready, we can start playing with the NodeJs debugging functionality. The first option we have is to run node inspect index.js (or the file we want to inspect), and we should receive this message in the terminal:
 < Debugger listening on ws://127.0.0.1:9229/0d56efaa-fd7f-4993-be76-0437122ae1cf
 < For help, see:
 <
 connecting to 127.0.0.1:9229... ok
 < Debugger attached.
 <
 Break on start in index.js:1
 > 1 const express = require("express");
  2 const app = express ;
  3 const cors = require("cors");
 debug>
Now, we are in the debugging domain. We can enter certain keywords to perform actions.
- Pressing c or cont will continue code execution until the next breakpoint or until the end.
- Pressing n or next will go to the next line.
- Pressing s or step will enter a function.
- Pressing will exit a function
- Writing pause will pause the running code.
If we pressed “n” a few times, and after seeing the value constant write watch('value') and press n once more, we would see something like this in the terminal:
 18 app.listen(port, => {
 debug> watch('value')
 debug>n
 break in index.js:18
 Watchers:
  0: value = 2

 16 app.use("/posts", routes);
As you can see, as we specify that we want to observe the value constant, the JS debugger shows us the result of the operation, and that is number 2. This approach is similar to adding console.log statements in some sense but mostly useful in a very small scope. Imagine if we had to press n hundreds of times to get into a queue – that wouldn't be very productive. For this, we have another option.
Debugging using the debugger keyword
Here we change the index.js file by adding the debugger keyword after the value constant:
 const express = require("express");
 const app = express;
 const cors = require("cors");
 const routes = require("./routes/posts.js");

 const port = process.env.PORT 5000;

 app.use(cors );

 app.get(" (req, res) => {
  res.send("Hello World!");
 });

 const value = 5 - 3;
 //added debugger keyword after the value constant
 debugger;

 app.use("/posts", routes);

 app.listen(port, => {
console.log(`Example app listening at
 });
When we run node inspect index.js again, now instead of manually pressing the n key repeatedly, we can press c, and the debugger will go directly to where the debugger keyword was declared. We can therefore add our observers as we wish, as before. Here is an excerpt of the complete workflow described:
 sirius@sirius-20t8001ttx ~/c/a/testing-tips-nodejs (SIGINT)> node inspect index.js
 < Debugger listening on ws: //127.0.0.1:9229/03f908f6 -b6ce-4337-87b4-ed7c6eb2a027
 <
 < For help, see: https://nodejs.org/en/docs/inspector
 <
 OK
 < Debugger attached.
 <
 Break on start in index.js:1
 > 1 const express = require("express");
  2 const app = express ;
  3 const cors = require("cors");
 //pressing c here
 debug>c
//jumps directly to line 15 where the debugger keyword has been declared
 break in index.js:15
 13
 14 const value = 5 - 3;
 >15 debuggers;
 16
 17 app.use("/posts", routes);
 //adding watcher to value constant
 debug> watch('value')
 //going to the next line
 debug>n
 break in index.js:17
 //we can see our watchers
 Watchers:
 0: value = 2

 15 debugger;
 16
 >17 app.use("/posts", routes);
 18
 19 app.listen(port, => {
 debug>
Chrome DevTools: the Node JS debugger
Now let's change our strategy a little and use other debugging tools. Imagine we made a mistake in our controllers. Instead of writing const rating = crypto.randomInt(1, 11); , we write const rating = crypto.randomInt(-11, 11); .
Now, because we write -11 instead of 1, the ratings will also have negative numbers, and we don't want that. We run our application, send the get request, and notice that the ratings include negative numbers. While this is a pretty obvious case, imagine we're dealing with a huge function that calls other functions that call other functions, and we need to figure out where the problem arises. If we're using Chrome or Chromium-based browsers, we have Chrome Dev Tools at our disposal to check the state of the application at any debug point in a way that's easier to follow visually. To start, let's stop our server and change the postData function in ontrollers.js like this:
    const postData = response.data.map((post) => {
      const rating = crypto.randomInt(-11, 11); // Generate a random integer between 1 and 10, inclusive
console.log(rating);
 debugger;

 return {
 ...post,
 rating,
 };
 });
Then we re-run our application with a slightly different command => node –inspect index.js. Now, with the lines included before the inspect keyword, we have access to the server through our browser. Go to the following link => chrome://inspect/#devices . Here, we should see something like this:
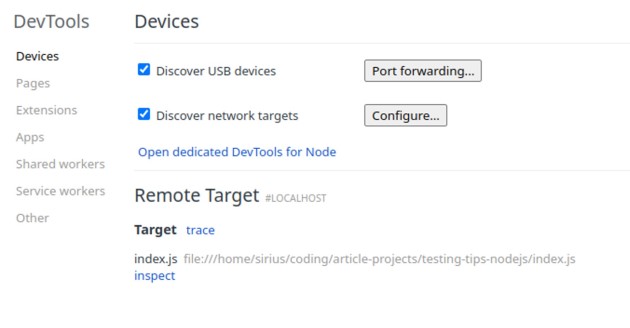
Here, we will click on “Open dedicated DevTools for Node”, which will open something like this:
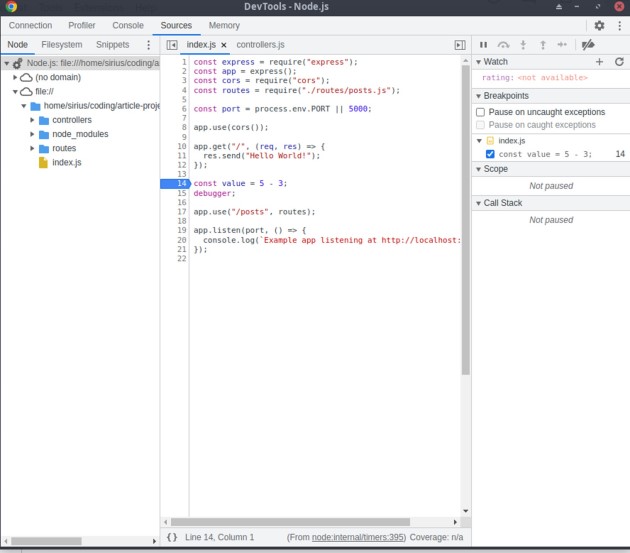
There are a lot of things going on here. As you can see, on the left we can change the directories and files as we want and inspect the code. On the right we can define watchers, the keywords that the debugger will look for. We enter “rating” there, because we want to see the value of the ratings. If we hadn't included the debugger keyword in the controllers.js file as well, we wouldn't be able to see the value of the ratings. Now, if we open Postman and resend a get request to /posts, we should get a screen like this:
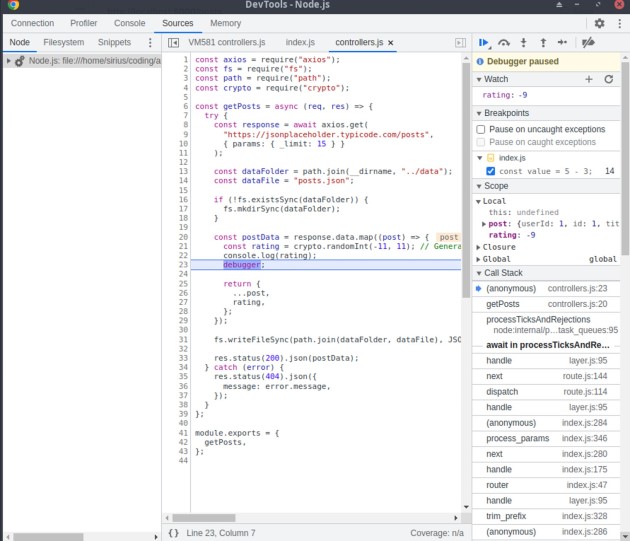
Now you see that the rating value is -9. We can infer that we did something wrong in our code that caused this behavior and check if the sort constant accepts values between -11 and 11. Now, if we clicked F8 to resume execution, we would see a different value like so:
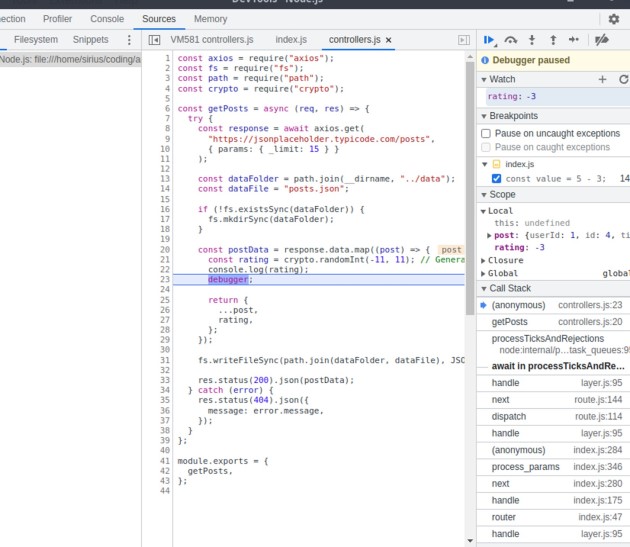
Furthermore, if we check what is happening with Postman, we will see that the execution is still in progress because the application stops at the debugger keyword. Now we can also do the same thing directly in VS Code.
Debugging with Visual Studio Code
Now it's time to debug the code directly in VS Code. The first thing we need to do is close our watch server and open VS Code. There, on the left side, there should be a Run and Debug section. If we click on it, a screen like this will be displayed:
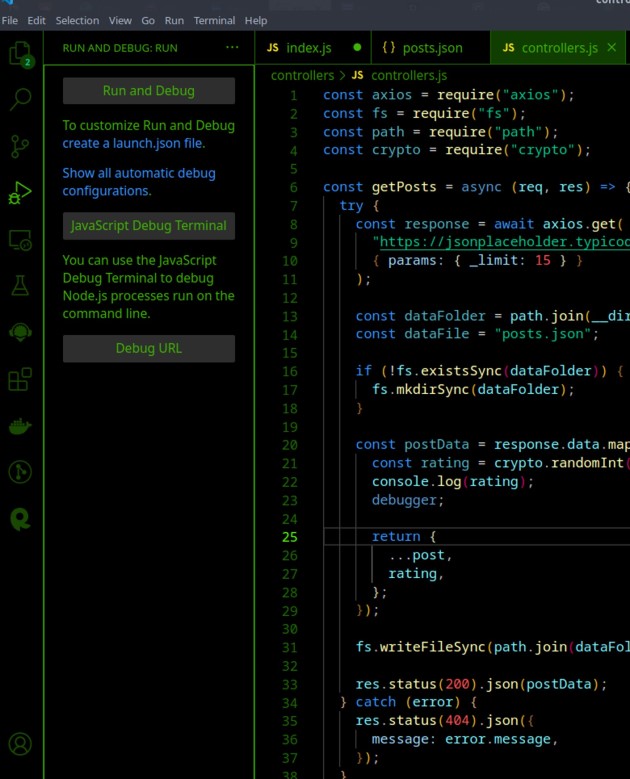
Here we will choose “create a launch.json file” and then on the command line, if it opens, we will choose “NodeJs”, and it will create a launch.json file for us that looks like this:
 {
    // Use IntelliSense to learn about possible attributes.
    // Hover to view descriptions of existing attributes.
    // For more information, visit:
    "version": "0.2.0",
    "configurations": (
        {
"type": "node",
 "request": "launch",
 "name": "Launch Program",
 "skipFiles": (
 "<node_internals>/**"
 ),
 "program": "${workspaceFolder}/index.js"
 }
 )
 }
Now, if we click start in the top left corner, or we click F5 this time, the inspection server itself will start. If we send a get request via Postman, it will send us to the debugger keyword in the controllers.js file:
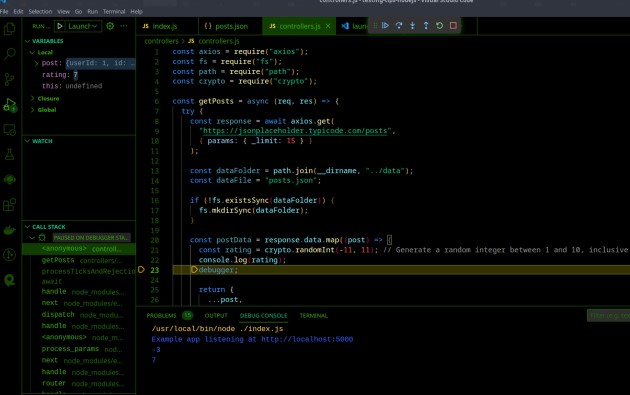
Here too, just like Chrome Dev Tools, each update would result in a different rating value. Using this tool and technique we can again observe and see that there is something wrong with the ratings and then we must check what is causing the problem.
Conclusion
Throughout this tutorial, we explore various strategies for debugging NodeJS applications, highlighting the importance of methods beyond simple console.log statements. As a way to ensure a smoother development process, it may be advantageous to outsource NodeJS development. By doing so, you will be able to leverage the skills and experience of experts in the field, thereby improving the overall quality and efficiency of your project.
If you liked this article, check out our other guides below;
- Change Node Version: A Step-by-Step Guide
- Node JS Cache: Increasing Performance and Efficiency
- Unlock the power of Node.JS microservices
- Unlocking the Power of Websocket Nodejs
- Best Text Editors and Node JS IDE for App Development
Common questions
What are some best practices to follow when debugging in Node.js?
During a debugging session in Node.js, some of the best practices to follow include gaining a comprehensive understanding of the built-in debugger and using it effectively. It's also beneficial to incorporate external tools like Chrome DevTools and VS Code into your debug setup. Instead of relying heavily on “console.log”, consider replacing it with more robust logging and debugging tools where possible. It is also crucial to familiarize yourself with the 'inspect' and 'inspect-brk' options available in Node.js, which allow you to stop the execution of javascript code and step through it methodically. Incorporating linters into your debug configuration is also recommended, as they help identify common coding errors early on.
Lastly, the practice of writing unit tests remains invaluable; Not only does it help identify bugs, but it also works preventatively to avoid potential future issues.
How can I use built-in debugging tools in Node.js to improve my debugging process?
Node.js is equipped with a robust built-in debugging tool that can remarkably amplify your debugging process. To use this tool, start the debugger by running your application with the 'inspect' or 'inspect-brk' command-line options, followed by the path to your script. For example, using 'node inspect application' would put your application in debug mode. The 'inspect-brk' option, on the other hand, allows your script to start but pauses execution until a debug client is connected, giving you the ability to debug your script's initialization process.
Once the debug client is operational, it allows you to meticulously step through your code, investigate variables, and evaluate expressions. By incorporating the 'debugger' keyword into your code, you can set breakpoints that pause the execution of your script, allowing you to closely examine the state of the program. This can be conveniently monitored in the debug console. If you prefer a graphical interface for a more intuitive experience, both the Chrome DevTools debugger and VS Code provide viable solutions. Your debug panel can connect to your Node debug session, ensuring a user-friendly debugging process that visually represents your code state and execution flow.
Can you give an example of an advanced Node.js debugging technique and how to use it effectively?
An advanced Node.js debugging technique involves using the 'post-mortem' debugging process. In this method, a 'core dump', or a detailed snapshot of the application state, is created when the application encounters a crash or other critical event. Analyzing these core dumps, which can be achieved using tools like 'llnode' and 'mdb_v8', offers deep insights into what led to the problem. Generating a core dump can be initiated from the debug prompt using built-in Node.js options or external modules like 'node-report' when running your application, for example 'node app'.
When your application crashes or is triggered manually, 'node-report' will generate a diagnostic summary file that is easy to understand. This file presents vital information about the JavaScript stack, native stack, heap statistics, system information, and resource usage, which can be indispensable when debugging difficult-to-reproduce issues.
Although this advanced technique requires in-depth knowledge of the language and runtime, its effective use can expose the underlying cause of complicated bugs, especially those related to performance and system crashes.
Source: BairesDev