Understand how Java Garbage Collection works and optimize memory usage in your applications. Learn about the intricacies of memory management in Java.

Garbage collection is a crucial process that can help any Java development company. This powerful feature in programming languages skillfully manages memory allocation and deallocation, preventing memory leaks and optimizing resource utilization. Acting as a constant caretaker, it diligently cleans up unused objects, preventing us from being inundated with unnecessary digital clutter. As a Java development company, we often encounter this challenge in our coding efforts, and garbage collection provides an elegant solution to this. Let's delve deeper into this sophisticated mechanism.
GC, the unsung hero of Java programming, not only cleans us up but also makes Java memory efficient. It's crucial because we as programmers need to manage memory well, freeing up resources, especially unreferenced objects, and we often forget this in our search for new ideas (and sometimes out of laziness).
How Java Garbage Collection Works
Let's look into the details of how this silent cleaner works in Java.
Garbage collection in Java is a process that automatically manages memory by reclaiming unused objects that are no longer in use.
Memory Structure
In Java, memory is divided into stack memory, heap memory and metaspace. Let's take a closer look.
stack memory
Stack memory is a region of memory that stores local variables, object references , method parameters, and other method-specific data during the execution of a method. The stack memory size is fixed.
stack memory
Heap memory is a region of memory used to store the actual objects. Its size is fixed and can dynamically increase or decrease as needed.
Here is an example.
Integer num = new Integer(12);
This creates a variable “num” in stack memory and a new Integer object in heap memory. The “num” variable in stack memory stores a reference to the original object.

Metaspace
Metaspace is a part of native memory used by the Java Virtual Machine (JVM) to store metadata about static classes and methods. It replaced the Permanent Generation heap memory, which was part of the heap memory.
In previous versions of Java, PermGen was used to store metadata about static classes and methods. But it had some limitations. One of them was the fact that they were fixed in size. Another problem was that PermGen space was garbage collected along with the rest of the heap, which led to performance issues.
Metaspace is dynamically resizable and is separately garbage collected. It allows sharing of class metadata between multiple JVM instances, which can reduce memory usage and improve performance.
Eligibility for garbage collection
Live accessible objects are those that are being referenced by some part of the program, while dead or inaccessible objects are those that are not referenced by any part of the program. For example:
Integer num = new Integer(12);
num = null;
As discussed, the first line creates a new Integer object in heap memory and a variable in stack memory, which stores a reference to the original object.
So, on the next line, we are changing the reference of “num”, which means that “num” does not refer to the Integer object we created earlier. In fact, this Integer object is not being referenced by any part of our program. Therefore, it is an inaccessible or dead object. Dead objects can be collected as trash.
Objects become inaccessible when:
- All variables that reference this object no longer reference it (they are either set to null or set to a different value).
- Objects created within a method will become inaccessible when that method is freed from stack memory.
Islands of Isolation
An isolation island refers to a group of objects that reference each other but are no longer referenced by any object in the program. In the example below, “a” and “b” reference each other, but are not referenced by any other object.
 class Node {

 Node next;

 Node prev;

 }

Node a = new Node ;

 Node b = new Node ;

 a.next = b;

 b.prev = a;
To break the island of isolation, we need to change object references. Here, they can be garbage collected only after changing the references of “a” and “b” (e.g. setting a and b to null).
Parts of heap memory
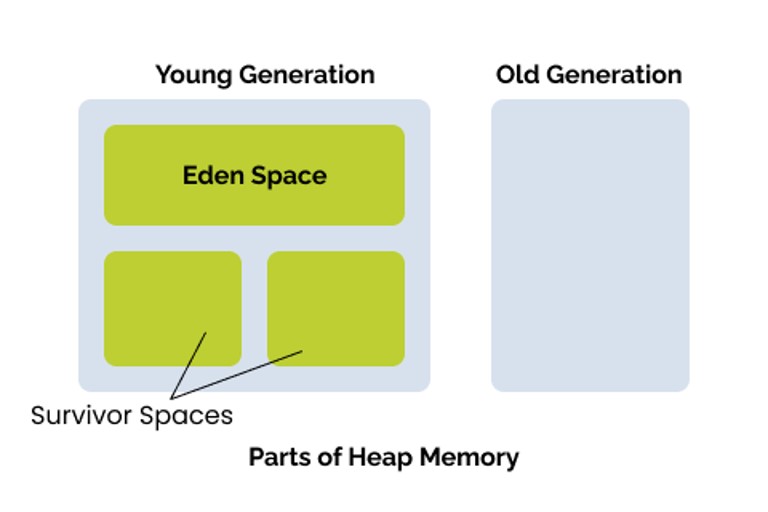
As discussed earlier, heap memory is the part of memory responsible for storing objects. It is divided into the Young Generation Space and the Old Generation Space.
Young generation
In Java, the younger generation heap memory is where new objects are created. This memory segment is divided into two sections: the Eden space and the Survivor spaces.
Eden Space
The Eden space is the part of the young generational space where new objects are allocated.
Survival Spaces
Objects in the Eden space that survive a round of garbage collection are promoted to the survivor spaces.
The number of Survivor Spaces in the Java Garbage Collector depends on the specific collector being used. The number of Survival Spaces depends on the specific collector being used. In the Parallel Collector and the CMS Collector, there are several survivor spaces. The Parallel Collector divides the surviving space into multiple regions, while the CMS Collector uses multiple surviving spaces. We'll take a closer look at the different Java garbage collectors below.
Old Generation
Objects that survive a certain number of garbage collections are promoted to the old generation. Old generation objects have a longer lifespan. They are not eligible for minor GC and are only removed during a major garbage collection.
The old generation is also called the stable generation.
Steps involved in garbage collection
Java garbage collection works by continuously monitoring the Java Virtual Machine's heap memory to identify objects that are no longer in use.
Java garbage collection is performed in the following steps:
- Tagging: The GC first identifies all active objects on the stack and tags them.
- Scan: After all active objects have been identified and marked, the GC scans the heap and frees memory that is no longer in use. The memory is then available to be allocated to new objects.
- Compression: In some Java garbage collection algorithms, after scanning, the remaining objects are compressed, which means they are moved to one end of the heap, making it easier for the JVM to allocate new objects.
Smaller garbage collector
Minor garbage collection is the process of identifying and collecting garbage from the younger generation while keeping it garbage-free and reducing the frequency of major Java garbage collection cycles.
Secondary Java garbage collection works on a smaller heap size and is therefore considerably faster than primary garbage collection.
Here's how minor garbage collection works:
Eden Space Filling: As new objects are allocated to the Eden space, it eventually becomes full. When the Eden space becomes full, the garbage collector starts a smaller GC cycle.
Initial Marking: The garbage collector begins the secondary garbage collection cycle by performing an initial marking phase. During this phase, the garbage collector identifies all living objects in the Eden space and survivor spaces. The garbage collector marks these living objects to indicate that they should not be collected.
Copying collection: After the initial marking phase is complete, the garbage collector performs a copy collection phase. During this phase, the garbage collector copies all living objects from the Eden space and from one of the surviving spaces to the other surviving space.
Cleaning up unused space: After copying the active objects to the surviving space, the garbage collector cleans up the Eden space and the surviving space that was not used during the current garbage collection cycle. Any objects that have not been copied to the surviving space are considered garbage and are reclaimed by the garbage collector.
Object Promotion: Objects that have survived a certain number of garbage collection cycles will eventually be promoted to the old generation (also known as stable generation), where they will be managed by a different garbage collection algorithm optimized for living objects longer.
Multiple Cycles: If the surviving space that was used during the current Java garbage collection cycle becomes full, the collector runs additional secondary garbage collection cycles until either enough objects have been promoted to the old generation or the surviving space becomes empty again .

Large garbage collector
When the old generational space is filled, the great garbage collector hits. It is called “main” because it works on the entire heap and is invoked less frequently than the secondary garbage collector. It is generally more time-consuming and resource-intensive.
The steps involved in core garbage collection are very similar to those described above.
Types of Garbage Collectors in Java
Java offers a few different types of garbage collectors. Here is a list of all garbage collectors, how they work and their advantages.
Serial collector or stop and copy
Serial Garbage Collector is a type of GCr in Java that uses a single thread to perform the Java garbage collection process. It is mainly used in basic applications that have relatively simple memory usage patterns.
As you may have guessed, the Serial Garbage Collector works sequentially, which means it stops all threads in the application while the Java garbage collection process is running. This pause in application execution is sometimes called a “stop the world” event.
To use the Serial Collector, pass -XX:UseSerialCollector as an argument.
Example, java -XX:UseSerialCollector YourProgram

Advantages of the serial collector:
- Simplicity: This is the simplest and most straightforward garbage collector in Java. It takes up little space and requires minimal adjustment.
- Predictability: Because it uses a single thread, its behavior is predictable and easy to understand. This makes it useful for applications that require a predictable memory usage pattern.
- Very low overhead: This makes it useful for small applications where performance is critical.
Disadvantages of the serial collector:
- Not designed to scale: It is not designed to scale with the size of the heap or the number of processors available on the system.
- Poor memory usage: Provides poor utilization of available memory.
- Long pause times: Due to its design, long pause times are built into the process.
Parallel Collector
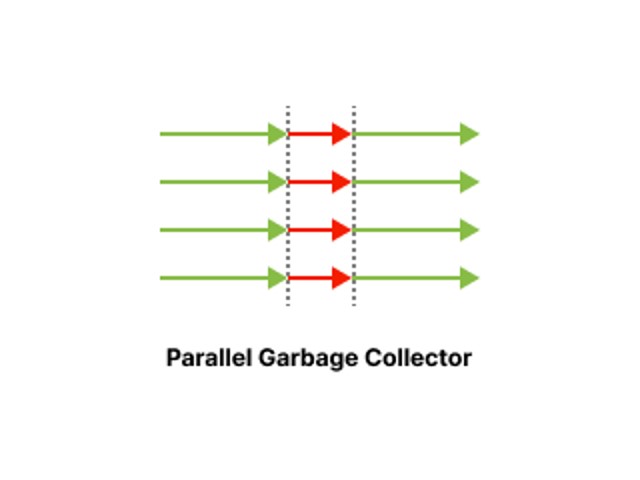
The Parallel Garbage Collector , serving as the default garbage collector in Java, is a method that uses multiple threads to increase garbage collection performance. It is particularly effective for larger applications with complex memory usage patterns.
By subdividing the heap into smaller segments, Parallel Garbage Collector uses multiple threads to run the garbage collection process simultaneously. Similar to the serial collector, the Parallel Collector also causes a temporary pause in application execution during garbage collection.
To use the Parallel Collector, pass -XX:+UseParallelGC as an argument.
Advantages of the parallel collector:
- Faster: Provides better performance compared to serial collectors due to the use of multiple threads, allowing for faster garbage collection operations.
- Better Scalability: Designed to scale effectively with heap size, making it suitable for applications with higher memory requirements.
Disadvantages of parallel collector:
- Longer pause times: Parallel Garbage Collector stops the application during the garbage collection process, which may result in longer pause times compared to other garbage collectors.
- Increased CPU overhead: Parallel Garbage Collector uses multiple threads, which can result in increased overhead and memory usage.
Simultaneous Mark Scan Collector
The CMS Collector (simultaneous marking and scanning) is another type of garbage collector. It works simultaneously with the application to perform the garbage collection process or, said another way, it uses multiple garbage collector threads. It is designed to minimize application pause times and reduce the performance impact of Java garbage collection.
To use CMSCollector, pass -XX:+UseConcMarkSweepGC as an argument.

Advantages of CMS:
- Low pause times: The CMS minimizes pause times during garbage collection, providing a smoother experience for latency-sensitive applications.
- Predictable: CMS offers more predictable garbage collection pauses, which can be crucial for real-time systems or applications with stringent performance requirements.
- Suitable for larger heaps: CMS maintains its performance even when the heap size increases, making it a viable option for applications with substantial memory demands.
Disadvantages of CMS:
- Higher CPU overhead: CMS consumes more CPU resources due to its concurrent nature, which can affect the overall performance of the application.
- Fragmentation risk: CMS is not an ideal choice for long-running applications as the heap can become fragmented over time. This fragmentation can lead to increased memory usage and decreased performance.
G1 Collector
Garbage First Collector (G1) is a garbage collection algorithm introduced in Java 7, designed to address the limitations of traditional garbage collectors such as Parallel Collector and CMS Collector. G1 is designed to be a throughput-oriented, low-pause collector that can handle very large heaps.
To use the G1 Collector, pass the argument:
-XX:+UseG1GC
Advantages of the G1 Collector:
- Low pause times: The G1 is designed to minimize pause times, which can make it suitable for real-time applications.
- Scalability: G1 is scalable, which makes it suitable for large applications with varying heap sizes.
Disadvantages of the G1 Collector:
- Overhead: G1 consumes more CPU resources compared to other garbage collectors, leading to increased CPU overhead.
- High initial marking time: The initial marking phase can take longer on G1, especially for large heap sizes, which can negatively impact application performance.
- Not suitable for small heaps : G1 Collector is not ideal for applications with small heap sizes because its benefits are best achieved in larger memory environments.
ZGC
The Z Garbage Collector (ZGC) is a Java garbage collector specifically designed to manage extremely large heaps (up to 16 TB) while maintaining minimal pause times. Its main objective is to minimize the duration of garbage collection processes, thus maximizing the application's performance.
Advantages of ZGC:
- Low pause times: It is designed to minimize pause times, making it suitable for real-time or latency-sensitive applications.
- Scalability: It is designed to scale according to the heap size and the number of available processors.
- High performance: It is optimized for high performance, achieving substantial throughput and minimizing the impact of Java garbage collection on application performance.
Disadvantages of ZGC:
- High memory overhead: ZGC requires a significant amount of memory to function efficiently.
- Limited Compatibility: ZGC is only available on certain platforms, including Linux/x64, and requires a minimum of JDK 11.
- Higher CPU utilization: Due to its advanced features, ZGC may consume more CPU resources compared to other garbage collectors, potentially affecting overall application performance.
Shenandoah Collector
Shenandoah is a Java garbage collector designed to provide ultra-low pause times while maintaining high throughput. As a concurrent garbage collector, it operates in parallel with the application, making it suitable for latency-sensitive applications.
To use the Shenandoah Collector, pass the argument:
-XX:+UnlockExperimentalVMOptions -XX:+UseShenandoahGC
Advantages of Shenandoah:
- Ultra-low pause times: Provides minimal pause times, making it ideal for real-time or latency-sensitive applications.
- Low memory overhead: Manages memory efficiently, reducing memory overhead.
- High throughput: Despite its focus on low pause times, Shenandoah still maintains high throughput, ensuring optimal application performance.
Disadvantages of the Shenandoah:
- Limited Compatibility: Shenandoah is only available on certain platforms, including Linux/x64, and requires a minimum of JDK 8u40.
- Higher CPU utilization: This can consume more CPU resources compared to other garbage collectors, potentially affecting overall application performance.
Sistema.gc
Runtime.getRuntime .gc or System.gc are methods that ask the JVM to perform garbage collection to free up memory – emphasis on the word “suggest”, as that is exactly what it does.
You cannot force garbage collection. If you are getting “ java.lang.OutOfMemoryError ”, calling System,gc will not solve the problem because the JVM usually tries to run a garbage collector before throwing “java.lang.OutOfMemoryError”. Possible fixes could be to use a different GC or increase the heap size.
In general, it is recommended that developers avoid calling System.gc directly and instead rely on the automatic garbage collection provided by the JVM.
Common problems with garbage collection and how to solve them
Here are some problems you may face:
Out of memory errors:
This error occurs when the JVM runs out of memory. To resolve this issue, developers can increase the heap size or optimize the application to use less memory.
- -Xmx: Sets the maximum heap size for your application.
- -Xms: Sets the initial heap size for your application.
For example, to set the maximum heap size to 2 gigabytes and the initial heap size to 512 megabytes, you can use the following command:
java -Xmx2g -Xms512m YourProgram
Long pause times:
Long pause times during garbage collection may cause the application to become unresponsive. To resolve this issue, you can choose a garbage collector designed for low pause times or tune the garbage collector parameters.
Memory loss:
Memory leaks occur when objects are not properly released from memory, leading to increased memory usage over time. To resolve this issue, developers can use tools like profilers to identify memory leaks and fix them.
Best practices for managing memory in Java
To avoid common problems with garbage collection and manage memory efficiently, here are some best practices:
- Set the reference to null: Always set the reference to null when you no longer need an object.
- Avoid creating unnecessary objects: Creating unnecessary objects can increase memory usage and cause more frequent garbage collection. You should avoid creating unnecessary objects and reuse existing objects when possible.
- Using anonymous object: This is when you do not store the reference to the object.
Example, createUser(new user ).
- Free resources when they are no longer needed: Objects that use external resources, such as file handles or database connections, should be freed when they are no longer needed to prevent memory leaks.
Conclusion
Understanding the mechanics of Java garbage collection is essential whether you are developing in-house or deciding to outsource Java development, especially if you want to improve the performance of your Java application. We've taken an in-depth look at this important part of Java programming, from the basics of how garbage collection works and the different types of garbage collectors to the finer points of memory management. Remember, even when you outsource Java development, choosing the right type of Java garbage collection and managing memory efficiently will make a big difference in the speed of your application. Keep exploring, keep coding, and remember that every efficiency can contribute to a smoother, faster application. Happy coding!
If you liked this, be sure to check out one of our other Java articles:
- Java Performance Tuning: 10 Proven Techniques to Maximize Java Speed
- 7 Best Java Profiler Tools for 2021
- Listed 9 Best Java Static Code Analysis Tools
- Java Unit Testing with JUnit 5: Best Practices and Techniques Explained
- Java x Kotlin: the main differences explained
Common questions
How can developers identify and diagnose memory leaks or inefficiencies in their Java applications?
Developers can identify and diagnose memory leaks or inefficiencies in their Java applications:
- Monitoring application memory usage and GC logs using tools like JConsole, VisualVM, or Java Flight Recorder.
- Analyzing heap dumps to identify objects that are taking up an excessive amount of memory.
- Using profiling tools like YourKit, JProfiler, or Java Mission Control to identify hotspots and memory usage patterns.
- Write and run performance tests that simulate real-world usage scenarios.
- Inspect code and review best practices for memory management, such as avoiding unnecessary object creation, minimizing object retention, and using appropriate data structures.
What are the tradeoffs between throughput, latency, and memory overhead when selecting and configuring a garbage collector for a Java application?
When choosing and configuring a garbage collector that Java uses for an application, developers must weigh the tradeoffs between throughput, latency, and memory overhead:
- Throughput: This refers to the application's ability to process workloads efficiently. Garbage collectors that emphasize high throughput may experience longer pauses during garbage collection, affecting application latency.
- Latency: This is the time it takes for an application to respond to a request. Garbage collectors that focus on low latency may consume more memory to minimize the frequency of garbage collection pauses, resulting in greater memory overhead.
- Memory overhead: This represents the amount of memory that the GC uses to manage the application's memory. Garbage collectors that require less memory may need to pause garbage collection more frequently, which can affect both throughput and latency.
Developers must carefully evaluate these tradeoffs when selecting and configuring a garbage collector for their Java application, taking into account the unique requirements and constraints of their specific use case.
Source: BairesDev


