HV, HB, HRC Hardness Comparison Chart
Hardness testing is the simplest and most direct method among mechanical property tests. To replace certain mechanical property tests with hardness tests, a relatively accurate conversion relationship between hardness and strength is required in production.
Experience has shown that there is an approximate relationship between the various hardness values of metallic materials and between hardness values and strength values. This is because the hardness value is determined by the resistance to initial plastic deformation and the resistance to continuous plastic deformation. The greater the strength of the material, the greater the resistance to plastic deformation and, therefore, the higher the hardness value.
1. Hardness comparison: Vickers hardness vs Brinell hardness vs Rockwell hardness
| Tensile strength N/ mm2 |
Vickers hardness | Brinell hardness | Rockwell hardness |
| Rm | High voltage | HB | CDH |
| 250 | 80 | 76 | |
| 270 | 85 | 80.7 | |
| 285 | 90 | 85.2 | |
| 305 | 95 | 90.2 | |
| 320 | 100 | 95 | |
| 335 | 105 | 99.8 | |
| 350 | 110 | 105 | |
| 370 | 115 | 109 | |
| 380 | 120 | 114 | |
| 400 | 125 | 119 | |
| 415 | 130 | 124 | |
| 430 | 135 | 128 | |
| 450 | 140 | 133 | |
| 465 | 145 | 138 | |
| 480 | 150 | 143 | |
| 490 | 155 | 147 | |
| 510 | 160 | 152 | |
| 530 | 165 | 156 | |
| 545 | 170 | 162 | |
| 560 | 175 | 166 | |
| 575 | 180 | 171 | |
| 595 | 185 | 176 | |
| 610 | 190 | 181 | |
| 625 | 195 | 185 | |
| 640 | 200 | 190 | |
| 660 | 205 | 195 | |
| 675 | 210 | 199 | |
| 690 | 215 | 204 | |
| 705 | 220 | 209 | |
| 720 | 225 | 214 | |
| 740 | 230 | 219 | |
| 755 | 235 | 223 | |
| 770 | 240 | 228 | 20.3 |
| 785 | 245 | 233 | 21.3 |
| 800 | 250 | 238 | 22.2 |
| 820 | 255 | 242 | 23.1 |
| 835 | 260 | 247 | 24 |
| 850 | 265 | 252 | 24.8 |
| 865 | 270 | 257 | 25.6 |
| 880 | 275 | 261 | 26.4 |
| 900 | 280 | 266 | 27.1 |
| 915 | 285 | 271 | 27.8 |
| 930 | 290 | 276 | 28.5 |
| 950 | 295 | 280 | 29.2 |
| 965 | 300 | 285 | 29.8 |
| 995 | 310 | 295 | 31 |
| 1030 | 320 | 304 | 32.2 |
| 1060 | 330 | 314 | 33.3 |
| 1095 | 340 | 323 | 34.4 |
| 1125 | 350 | 333 | 35.5 |
| 1115 | 360 | 342 | 36.6 |
| 1190 | 370 | 352 | 37.7 |
| 1220 | 380 | 361 | 38.8 |
| 1255 | 390 | 371 | 39.8 |
| 1290 | 400 | 380 | 40.8 |
| 1320 | 410 | 390 | 41.8 |
| 1350 | 420 | 399 | 42.7 |
| 1385 | 430 | 409 | 43.6 |
| 1420 | 440 | 418 | 44.5 |
| 1455 | 450 | 428 | 45.3 |
| 1485 | 460 | 437 | 46.1 |
| 1520 | 470 | 447 | 46.9 |
| 1557 | 480 | 456 | 47 |
| 1595 | 490 | 466 | 48.4 |
| 1630 | 500 | 475 | 49.1 |
| 1665 | 510 | 485 | 49.8 |
| 1700 | 520 | 494 | 50.5 |
| 1740 | 530 | 504 | 51.1 |
| 1775 | 540 | 513 | 51.7 |
| 1810 | 550 | 523 | 52.3 |
| 1845 | 560 | 532 | 53 |
| 1880 | 570 | 542 | 53.6 |
| 1920 | 580 | 551 | 54.1 |
| 1955 | 590 | 561 | 54.7 |
| 1995 | 600 | 570 | 55.2 |
| 2030 | 610 | 580 | 55.7 |
| 2070 | 620 | 589 | 56.3 |
| 2105 | 630 | 599 | 56.8 |
| 2145 | 640 | 608 | 57.3 |
| 2180 | 650 | 618 | 57.8 |
| 660 | 58.3 | ||
| 670 | 58.8 | ||
| 680 | 59.2 | ||
| 690 | 59.7 | ||
| 700 | 60.1 | ||
| 720 | 61 | ||
| 740 | 61.8 | ||
| 760 | 62.5 | ||
| 780 | 63.3 | ||
| 800 | 64 | ||
| 820 | 64.7 | ||
| 840 | 65.3 | ||
| 860 | 65.9 | ||
| 880 | 66.4 | ||
| 900 | 67 | ||
| 920 | 67.5 | ||
| 940 |
2. Hardness comparison chart of common ferrous metals (approximate intensity conversion)
| Rockwell | Rockwell | Vickers | Brinell | Tensile strength |
| CDH | HR | High voltage | HB | N/ mm2 |
| 17 | – | 211 | 211 | 710 |
| 17.5 | – | 214 | 214 | 715 |
| 18 | – | 216 | 216 | 725 |
| 18.5 | – | 218 | 218 | 730 |
| 19 | – | 221 | 220 | 735 |
| 19.5 | – | 223 | 222 | 745 |
| 20 | – | 226 | 225 | 750 |
| 20.5 | – | 229 | 227 | 760 |
| 21 | – | 231 | 229 | 765 |
| 21.5 | – | 234 | 232 | 775 |
| 22 | – | 237 | 234 | 785 |
| 22.5 | – | 240 | 237 | 790 |
| 23 | – | 243 | 240 | 800 |
| 23.5 | – | 246 | 242 | 810 |
| 24 | – | 249 | 245 | 820 |
| 24.5 | – | 252 | 248 | 830 |
| 25 | – | 255 | 251 | 835 |
| 25.5 | – | 258 | 254 | 850 |
| 26 | – | 261 | 257 | 860 |
| 26.5 | – | 264 | 260 | 870 |
| 27 | – | 268 | 263 | 880 |
| 27.5 | – | 271 | 266 | 890 |
| 28 | – | 274 | 269 | 900 |
| 28.5 | – | 278 | 273 | 910 |
| 29 | – | 281 | 276 | 920 |
| 29.5 | – | 285 | 280 | 935 |
| 30 | – | 289 | 283 | 950 |
| 30.5 | – | 292 | 287 | 960 |
| 31 | – | 296 | 291 | 970 |
| 31.5 | – | 300 | 294 | 980 |
| 32 | – | 304 | 298 | 995 |
| 32.5 | – | 308 | 302 | 1010 |
| 33 | – | 312 | 306 | 1020 |
| 33.5 | – | 316 | 310 | 1035 |
| 34 | – | 320 | 314 | 1050 |
| 34.5 | – | 324 | 318 | 1065 |
| 35 | – | 329 | 323 | 1080 |
| 35.5 | – | 333 | 327 | 1095 |
| 36 | – | 338 | 332 | 1110 |
| 36.5 | – | 342 | 336 | 1125 |
| 37 | – | 347 | 341 | 1140 |
| 37.5 | – | 352 | 345 | 1160 |
| 38 | – | 357 | 350 | 1175 |
| 38.5 | – | 362 | 355 | 1190 |
| 39 | 70 | 367 | 360 | 1210 |
| 39.5 | 70.3 | 372 | 365 | 1225 |
| 40 | 70.8 | 382 | 375 | 1260 |
| 40.5 | 70.5 | 377 | 370 | 1245 |
| 41 | 71.1 | 388 | 380 | 1280 |
| 41.5 | 71.3 | 393 | 385 | 1300 |
| 42 | 71.6 | 399 | 391 | 1320 |
| 42.5 | 71.8 | 405 | 396 | 1340 |
| 43 | 72.1 | 411 | 401 | 1360 |
| 43.5 | 72.4 | 417 | 407 | 1385 |
| 44 | 72.6 | 423 | 413 | 1405 |
| 44.5 | 72.9 | 429 | 418 | 1430 |
| 45 | 73.2 | 436 | 424 | 1450 |
| 45.5 | 73.4 | 443 | 430 | 1475 |
| 46 | 73.7 | 449 | 436 | 1500 |
| 46.5 | 73.9 | 456 | 442 | 1525 |
| 47 | 74.2 | 463 | 449 | 1550 |
| 47.5 | 74.5 | 470 | 455 | 1575 |
| 48 | 74.7 | 478 | 461 | 1605 |
| 48.5 | 75 | 485 | 468 | 1630 |
| 49 | 75.3 | 493 | 474 | 1660 |
| 49.5 | 75.5 | 501 | 481 | 1690 |
| 50 | 75.8 | 509 | 488 | 1720 |
| 50.5 | 76.1 | 517 | 494 | 1750 |
| 51 | 76.3 | 525 | 501 | 1780 |
| 51.5 | 76.6 | 534 | – | 1815 |
| 52 | 76.9 | 543 | – | 1850 |
| 52.5 | 77.1 | 551 | – | 1885 |
| 53 | 77.4 | 561 | – | 1920 |
| 53.5 | 77.7 | 570 | – | 1955 |
| 54 | 77.9 | 579 | – | 1995 |
| 54.5 | 78.2 | 589 | – | 2035 |
| 55 | 78.5 | 599 | – | 2075 |
| 55.5 | 78.7 | 609 | – | 2115 |
| 56 | 79 | 620 | – | 2160 |
| 56.5 | 79.3 | 631 | – | 2205 |
| 57 | 79.5 | 642 | – | 2250 |
| 57.5 | 79.8 | 653 | – | 2295 |
| 58 | 80.1 | 664 | – | 2345 |
| 58.5 | 80.3 | 676 | – | 2395 |
| 59 | 80.6 | 688 | – | 2450 |
| 59.5 | 80.9 | 700 | – | 2500 |
| 60 | 81.2 | 713 | – | 2555 |
| 60.5 | 81.4 | 726 | – | – |
| 61 | 81.7 | 739 | – | – |
| 61.5 | 82 | 752 | – | – |
| 62 | 82.2 | 766 | – | – |
| 62.5 | 82.5 | 780 | – | – |
| 63 | 82.8 | 795 | – | – |
| 63.5 | 83.1 | 810 | – | – |
| 64 | 83.3 | 825 | – | – |
| 64.5 | 83.6 | 840 | – | – |
| 65 | 83.9 | 856 | – | – |
| 65.5 | 84.1 | 872 | – | – |
| 66 | 84.4 | 889 | – | – |
| 66.5 | 84.7 | 906 | – | – |
| 67 | 85 | 923 | – | – |
| 67.5 | 85.2 | 941 | – | – |
| 68 | 85.5 | 959 | – | – |
| 68.5 | 85.8 | 978 | – | – |
| 69 | 86.1 | 997 | – | – |
| 69.5 | 86.3 | 1017 | – | – |
| 70 | 86.6 | 1037 | – | – |
- Download the hardness table of ferrous and non-ferrous metals
Hardness Conversion Chart
(1) Hardness conversion chart for common metals (such as carbon steel, alloy steel, etc.)
| Rockwell hardness | Rockwell surface hardness | Vickers | Brinell | Coast | |||||
| HR | HRB | CDH | HR | 15N | 30N | 45N | High voltage | HB | SH |
| 60kgf | 100kgf | 150kgf | 100kgf | 15kgf | 30kgf | 45kgf | 50kgf | 3,000kgf | JIS |
| 85.6 | 68 | 76.9 | 93.2 | 84.4 | 75.4 | 940 | 97.6 | ||
| 85.3 | 67.5 | 76.5 | 93 | 84 | 74.3 | 920 | 96.4 | ||
| 85 | 67 | 76.1 | 92.9 | 83.6 | 74.2 | 900 | 95.2 | ||
| 84.7 | 66.5 | 75.7 | 92.7 | 83.1 | 73.6 | 880 | 94 | ||
| 84.4 | 65.9 | 75.3 | 92.5 | 82.7 | 73.1 | 860 | 92.8 | ||
| 84.1 | 65.3 | 74.8 | 92.3 | 82.2 | 72.2 | 840 | 91.5 | ||
| 83.8 | 64.7 | 74.3 | 92.1 | 81.7 | 71.8 | 820 | 90.2 | ||
| 83.4 | 64 | 73.8 | 91.8 | 81.1 | 71 | 800 | 88.9 | ||
| 83 | 63.3 | 73.3 | 91.5 | 80.4 | 70.2 | 780 | 87.5 | ||
| 82.6 | 62.5 | 72.6 | 91.2 | 79.7 | 69.4 | 760 | 86.2 | ||
| 82.2 | 61.8 | 72.1 | 91 | 79.1 | 68.6 | 740 | 84.8 | ||
| 81.8 | 61 | 71.5 | 90.7 | 78.4 | 67.7 | 720 | 83.3 | ||
| 81.3 | 60.1 | 70.8 | 90.3 | 77.6 | 66.7 | 700 | 81.8 | ||
| 81.1 | 59.7 | 70.5 | 90.1 | 77.2 | 66.2 | 690 | 81.1 | ||
| 80.8 | 59.2 | 70.1 | 89.8 | 76.8 | 65.7 | 680 | 80.3 | ||
| 80.6 | 58.8 | 69.8 | 89.7 | 76.4 | 65.3 | 670 | 79.6 | ||
| 80.3 | 58.3 | 69.4 | 89.5 | 75.9 | 64.7 | 660 | 78.8 | ||
| 80 | 57.8 | 69 | 89.2 | 75.5 | 64.1 | 650 | 78 | ||
| 79.8 | 57.3 | 68.7 | 89 | 75.1 | 63.5 | 640 | 77.2 | ||
| 79.5 | 56.8 | 68.3 | 88.8 | 74.6 | 63 | 630 | 76.4 | ||
| 79.2 | 56.3 | 67.9 | 88.5 | 74.2 | 62.4 | 620 | 75.6 | ||
| 78.9 | 55.7 | 67.5 | 88.2 | 73.6 | 61.7 | 610 | 74.7 | ||
| 78.6 | 55.2 | 67 | 88 | 73.2 | 61.2 | 600 | 73.9 | ||
| 78.4 | 54.7 | 66.7 | 87.8 | 72.7 | 60.5 | 590 | 73.1 | ||
| 78 | 54.1 | 66.2 | 87.5 | 72.1 | 59.9 | 580 | 72.2 | ||
| 77.8 | 53.6 | 65.8 | 87.2 | 71.7 | 59.3 | 570 | 71.3 | ||
| 77.4 | 53 | 65.4 | 86.9 | 71.2 | 58.6 | 560 | 70.4 | ||
| 77 | 52.3 | 64.8 | 86.6 | 70.5 | 57.8 | 550 | 505 | 69.6 | |
| 76.7 | 51.7 | 64.4 | 86.3 | 70 | 57 | 540 | 496 | 68.7 | |
| 76.4 | 51.1 | 63.9 | 86 | 69.5 | 56.2 | 530 | 488 | 67.7 | |
| 76.1 | 50.5 | 63.5 | 85.7 | 69 | 55.6 | 520 | 480 | 66.8 | |
| 75.7 | 49.8 | 62.9 | 85.4 | 68.3 | 54.7 | 510 | 473 | 65.9 | |
| 75.3 | 49.1 | 62.2 | 85 | 67.7 | 53.9 | 500 | 465 | 64.9 | |
| 74.9 | 48.4 | 61.6 | 84.7 | 67.1 | 53.1 | 490 | 456 | 64 | |
| 74.5 | 47.7 | 61.3 | 84.3 | 66.4 | 52.2 | 480 | 448 | 63 | |
| 74.1 | 46.9 | 60.7 | 83.9 | 65.7 | 51.3 | 470 | 441 | 62 | |
| 73.6 | 46.1 | 60.1 | 83.6 | 64.9 | 50.4 | 460 | 433 | 61 | |
| 73.3 | 45.3 | 59.4 | 83.2 | 64.3 | 49.4 | 450 | 425 | 60 | |
| 72.8 | 44.5 | 58.8 | 82.8 | 63.5 | 48.4 | 440 | 415 | 59 | |
| 72.3 | 43.6 | 58.2 | 82.3 | 62.7 | 47.4 | 430 | 405 | 58 | |
| 71.8 | 42.7 | 57.5 | 81.8 | 61.9 | 46.4 | 420 | 397 | 56.9 | |
| 71.4 | 41.8 | 56.8 | 81.4 | 61.1 | 45.3 | 410 | 388 | 55.9 | |
| 70.8 | 40.8 | 65 | 81 | 60.2 | 44.1 | 400 | 379 | 54.8 | |
| 70.3 | 39.8 | 55.2 | 80.3 | 59.3 | 42.9 | 390 | 369 | 53.7 | |
| 69.8 | 110 | 38.8 | 54.4 | 79.8 | 58.4 | 41.7 | 380 | 360 | 52.6 |
| 69.2 | 37.7 | 53.6 | 79.2 | 57.4 | 40.4 | 370 | 350 | 51.5 | |
| 68.7 | 109 | 36.6 | 52.8 | 78.6 | 56.4 | 39.1 | 360 | 341 | 50.4 |
| 68.1 | 35.5 | 51.9 | 78 | 55.4 | 37.8 | 350 | 331 | 49.3 | |
| 67.6 | 108 | 34.4 | 51.1 | 77.4 | 54.4 | 36.5 | 340 | 322 | 48.1 |
| 67 | 33.3 | 50.2 | 76.8 | 53.6 | 35.2 | 330 | 313 | 47 | |
| 66.4 | 107 | 32.2 | 49.4 | 76.2 | 52.3 | 33.9 | 320 | 303 | 45.8 |
| 65.8 | 31.6 | 48.4 | 75.8 | 51.8 | 32.8 | 310 | 294 | 44.6 | |
| 65.2 | 105.5 | 29.8 | 47.5 | 74.9 | 50.2 | 31.1 | 300 | 284 | 43.4 |
| 64.8 | 29.2 | 47.1 | 74.6 | 49.7 | 30.4 | 295 | 280 | 42.8 | |
| 64.5 | 104.5 | 28.5 | 46.5 | 74.2 | 49 | 29.5 | 290 | 275 | 42.2 |
| 64.2 | 27.8 | 46 | 73.8 | 48.4 | 28.7 | 285 | 270 | 41.6 | |
| 63.8 | 103.5 | 27.1 | 45.3 | 73.4 | 47.8 | 27.9 | 280 | 265 | 40.9 |
| 63.5 | 26.4 | 44.9 | 73 | 47.2 | 27.1 | 275 | 261 | 40.3 | |
| 63.1 | 102 | 25.6 | 44.3 | 72.6 | 46.4 | 26.2 | 270 | 256 | 39.7 |
| 62.7 | 24.8 | 43.7 | 72.1 | 45.7 | 25.2 | 265 | 252 | 39 | |
| 62.4 | 101 | 24 | 43.1 | 71.6 | 45 | 24.3 | 260 | 247 | 38.4 |
| 62 | 23.1 | 42.2 | 71.1 | 44.2 | 23.2 | 255 | 243 | 37.8 | |
| 61.6 | 99.5 | 22.2 | 41.7 | 70.6 | 43.4 | 22.2 | 250 | 238 | 37.2 |
| 61.2 | 21.3 | 41.1 | 70.1 | 42.5 | 21.1 | 245 | 233 | 36.5 | |
| 60.7 | 98.1 | 20.3 | 40.3 | 69.6 | 41.7 | 19.9 | 240 | 228 | 35.9 |
| 96.7 | 18 | 230 | 219 | 34.1 | |||||
| 95 | 15.7 | 220 | 209 | 33.2 | |||||
| 93.4 | 13.4 | 210 | 200 | 31.8 | |||||
| 91.5 | 11 | 200 | 190 | 30.4 | |||||
| 89.5 | 8.5 | 190 | 181 | 29 | |||||
| 87.1 | 6 | 180 | 171 | 27.7 | |||||
| 85 | 3 | 170 | 162 | 26.5 | |||||
| 81.7 | 0 | 160 | 152 | 25 | |||||
| 78.7 | 150 | 143 | 23.7 | ||||||
| 78 | 140 | 133 | 22.1 | ||||||
| 71.2 | 130 | 124 | 20.6 | ||||||
| 66.7 | 120 | 114 | 19.1 | ||||||
| 62.3 | 110 | 105 | 17.6 | ||||||
| 56.2 | 100 | 95 | 16.1 | ||||||
(2) Hardness conversion chart for soft metals (such as copper and aluminum)
| Rockwell hardness | Rockwell surface hardness | Vickers hardness | |||
| HRB | HRF | 15T | 30T | 45T | High voltage |
| 100kgf | 60kgf | 15kgf | 30kgf | 45kgf | 50kgf |
| 93.5 | 110 | 90 | 77.5 | 66 | 196 |
| 109.5 | 65.5 | 194 | |||
| 93 | 77 | 65 | 192 | ||
| 92.5 | 109 | 76.5 | 64.5 | 190 | |
| 92 | 89.5 | 64 | 188 | ||
| 91.5 | 108.5 | 76 | 63.5 | 186 | |
| 91 | 75.5 | 63 | 184 | ||
| 90.5 | 108 | 89 | 62.5 | 182 | |
| 90 | 107.5 | 75 | 62 | 180 | |
| 89 | 74.5 | 61.5 | 178 | ||
| 88.5 | 107 | 61 | 176 | ||
| 88 | 88.5 | 74 | 60.5 | 174 | |
| 87.5 | 106.5 | 73.5 | 60 | 172 | |
| 87 | 59.5 | 170 | |||
| 86 | 106 | 88 | 73 | 59 | 168 |
| 85.5 | 72.5 | 58.5 | 166 | ||
| 85 | 105.5 | 72 | 58 | 164 | |
| 84 | 105 | 87.5 | 57.5 | 162 | |
| 83.5 | 71.5 | 56.7 | 160 | ||
| 83 | 104.5 | 71 | 56 | 158 | |
| 82 | 104 | 87 | 70.5 | 55.5 | 156 |
| 81.5 | 103.5 | 70 | 54.5 | 154 | |
| 80.5 | 103 | 54 | 152 | ||
| 80 | 86.5 | 69.5 | 53.5 | 150 | |
| 79 | 102.5 | 69 | 53 | 148 | |
| 78 | 102 | 68.5 | 52.5 | 146 | |
| 77.5 | 101.5 | 86 | 68 | 51.5 | 144 |
| 77 | 101 | 67.5 | 51 | 142 | |
| 76 | 100.5 | 85.5 | 67 | 50 | 140 |
| 75 | 100 | 66.5 | 49 | 138 | |
| 74.5 | 99.5 | 85 | 66 | 48 | 136 |
| 73.5 | 99 | 65.5 | 47.5 | 134 | |
| 73 | 98.5 | 84.5 | 65 | 46.5 | 132 |
| 72 | 98 | 84 | 64.5 | 45.5 | 130 |
| 71 | 97.5 | 63.5 | 45 | 128 | |
| 70 | 97 | 83.5 | 63 | 44 | 126 |
| 69 | 96.5 | 62.5 | 43 | 124 | |
| 68 | 96 | 83 | 62 | 42 | 122 |
| 67 | 95.5 | 61 | 41 | 120 | |
| 66 | 95 | 82.5 | 60.5 | 40 | 118 |
| 65 | 94.5 | 82 | 60 | 39 | 116 |
| 64 | 94 | 81.5 | 59.5 | 38 | 114 |
| 63 | 93 | 81 | 58.5 | 37 | 112 |
| 62 | 92.6 | 80.5 | 58 | 35.5 | 110 |
| 61 | 92 | 57 | 34.5 | 108 | |
| 59.5 | 91.2 | 80 | 56 | 33 | 106 |
| 58 | 90.5 | 79.5 | 55 | 32 | 104 |
| 57 | 89.8 | 79 | 54.5 | 30.5 | 102 |
| 56 | 89 | 78.5 | 53.5 | 29.5 | 100 |
| 54 | 88 | 78 | 52.5 | 28 | 98 |
| 53 | 87.2 | 77.5 | 51.5 | 26.5 | 96 |
| 61.6 | 86.6 | 77 | 50.5 | 24.5 | 94 |
| 49.5 | 85.4 | 76.5 | 49 | 23 | 92 |
| 47.5 | 84.4 | 75.5 | 48 | 21 | 90 |
| 46 | 83.5 | 75 | 47 | 19 | 88 |
| 44 | 82.3 | 74.5 | 45.5 | 17 | 86 |
| 42 | 81.2 | 73.5 | 44 | 14.5 | 84 |
| 40 | 80 | 73 | 43 | 12.5 | 82 |
| 37.5 | 78.6 | 72 | 41 | 10 | 80 |
| 35 | 77.4 | 71.5 | 39.5 | 7.5 | 78 |
| 32.5 | 76 | 70.5 | 38 | 4.5 | 76 |
| 30 | 74.8 | 70 | 36 | 1 | 74 |
| 27.5 | 73.2 | 69 | 34 | 72 | |
| 24.5 | 71.6 | 68 | 32 | 70 | |
| 21.5 | 70 | 67 | 30 | 68 | |
| 18.5 | 68.5 | 66 | 28 | 66 | |
| 15.5 | 66.8 | 65 | 25.5 | 64 | |
| 12.5 | 65 | 63.5 | 23 | 62 | |
| 10 | 63 | 62.5 | 20.5 | 60 | |
| 61 | 61 | 18 | 58 | ||
| 58.8 | 60 | 15 | 56 | ||
| 56.5 | 58.5 | 12 | 54 | ||
| 53.5 | 57 | 52 | |||
| 50.5 | 55.5 | 50 | |||
| 49 | 54.5 | 49 | |||
| 47 | 53.5 | 48 | |||
| 45 | 47 | ||||
| 43 | 46 | ||||
| 40 | 45 | ||||
Approximate HRC/HB Conversion Tips
- When the hardness is greater than 20HRC, 1HRC≈10HB,
- When the hardness is less than 20HRC, 1HRC≈11.5HB.
Note: When considering cutting processing, a general conversion of 1HRC ≈ 10HB applies (the hardness of the workpiece material may vary slightly).
The most commonly used indentation hardness tests for metallic materials are the Brinell, Rockwell, and Vickers hardness tests.
The hardness value indicates the ability of a material to resist plastic deformation caused by the intrusion of another object.
When measuring hardness using the rebound method, the hardness value represents the extent of the elastic deformation function of the metal.
What is metallic hardness?
Hardness is a metric that measures a material's resistance to local deformations, such as plastic deformation, indentations or scratches.
It is a crucial factor in determining the hardness of a material.
Types of metal hardness
According to different testing methods, there are three types of hardness.
① Scratch hardness
Hardness is mainly used to compare the resistance to local deformation of various minerals.
The process involves using a rod with a hard and soft end to test the material by sliding it along the rod.
The softness or hardness of the material is determined based on the length of the scratch it leaves on the shaft.
Typically, scratches made by harder materials are longer and those made by softer materials are shorter.
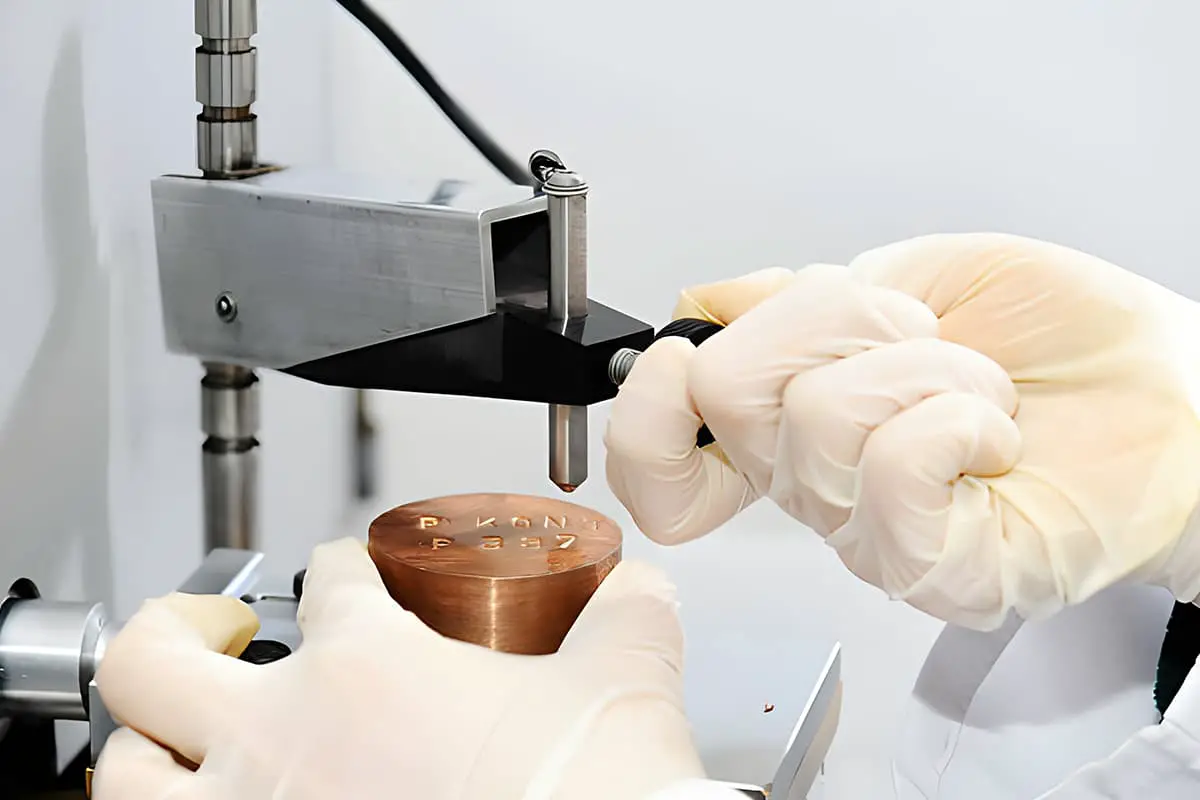
② Indentation hardness
Indentation hardness test is mainly used to evaluate metal materials. It involves applying a specific indenter to the surface of the material under test with a specific load.
Material hardness is determined by comparing the amount of local plastic deformation at the surface of the material.
There are several types of indentation hardness tests, including Brinell hardness, Rockwell hardness, Vickers hardness, and microhardness, which differ in terms of the indenter used, the load applied, and the duration of the load.
③ Recovery hardness
The rebound hardness test is mainly used for metallic materials. The method involves using a special small hammer that drops from a specific height to impact the material sample being tested.
The hardness of the material is determined by the amount of strain energy stored and then released from the sample during impact, which is measured by the rebound height of the hammer.