Abstract: Active powder pool coupled TIG welding is a new and efficient welding method that can be used to weld almost all metals by selecting the appropriate active agent powder.
This study focuses on active TIG welding arc coupled to AC powder pool using MnCl2 as activating agent. The plasma spectrum was collected and the arc plasma temperature was analyzed over time using the Boltzmann drawing method. The influence of MnCl2 on the AC arc was also studied by comparing it to the traditional TIG AC arc.
The results showed that for the traditional TIG AC arc, the spectral intensity of the arc in the EN period was greater than in the EP period, the voltage in the EN period was lower than in the EP period, and the temperature in the EN period was also lower.
However, the introduction of the active agent MnCl2 increased the core temperature and voltage in the EN and EP periods of the active TIG arc coupled to AC powder pool, resulting in a significant increase in weld penetration compared to traditional AC TIG welding.
Related Reading: MIG vs TIG Welding
Preface
The Barton Welding Research Institute first introduced the concept of argon arc welding in a flux layer, which led to increased attention to active welding methods. Among these methods, active TIG welding has received the greatest research focus. By selecting the appropriate process parameters and active flux, the efficiency and quality of TIG welding can be greatly improved.
However, manual application of the active agent coating can be time-consuming and may not guarantee consistent quality. Furthermore, for metals such as aluminum and magnesium, traditional methods of introducing active elements through active gas, such as AA-TIG welding, GPCA-TIG welding and AA-TIG welding, are not effective.
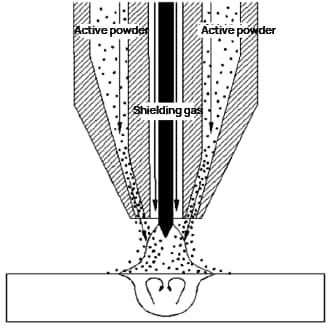
To solve these problems, Lanzhou University of Technology proposed powder pool coupled activation TIG (PPCA-TIG) welding. This method uses a double-layer gas system for welding, with an inner layer of inert gas to protect the tungsten electrode and molten metal, and an outer layer that uses an automatic powder feeding device to introduce the agent powder. active with the shielding gas. in the arc molten pool coupling system.
This interaction between the active flux and the molten pool of the arc results in greater penetration and greater efficiency, facilitating the achievement of automated and mechanized welding. Spectral analysis is a widely used method in plasma research due to its wealth of information and accuracy in temperature measurement. Previous studies, such as those by Tanaka et al. and Chai Guoming et al. analyzed the composition and temperature distribution of active TIG arcs using spectra.
The periodic switching of the AC TIG arc is a well-known characteristic. Although some researchers have analyzed the change in arc electron density over time through spectral methods, the change in arc temperature is rarely reported.
In this study, the change in arc temperature with time was studied using the Boltzmann mapping method in combination with arc voltage analysis for AC TIG arcs and AC PPCA-TIG arcs using MnCl. 2 as activator. The results of this study will provide insights into the influence of MnCl 2 activator powder on arc characteristics when introduced into the arc with external gas.

1. Test method
1.1 Diagnosis principle of Boltzmann mapping method
The Boltzmann mapping method is used to measure plasma temperature by analyzing the relative intensity of multiple spectral lines in the plasma. If the plasma is in local thermodynamic equilibrium, the radiation coefficient of each spectral line of the plasma can be expressed mathematically.

Calculate the logarithm of both sides of equation (1) to obtain

Where K=ln (h/4 π (n/z)), regardless of the type of spectral line.
The Boltzmann graphical method is used to determine the plasma excitation temperature. To calculate the temperature, multiple spectral lines of the same particle (atom or ion) are selected and the relevant parameters of the corresponding spectral lines (excited state energy E, transition probability A and statistical weight g) are obtained. The ordinate is then calculated as ln(εL/νAjgj) and the abscissa is E. Points are plotted for each set of parameters and a least squares fit is performed on the points.
The slope of the fitted line is (-1/kBT), which allows the plasma excitation temperature T to be resolved.
Note that plasma does not need to strictly adhere to local thermodynamic equilibrium conditions, making the Boltzmann graphical method highly accurate, simple, and convenient to use.
To increase accuracy, the following criteria should be considered when choosing spectral lines:
① Avoid choosing spectral lines corresponding to energy levels with low particle number density close to the ground state energy level;
② Choose spectral lines with the smallest wavelength range possible;
③ Measure the emission coefficient of at least five spectral lines;
④ Make sure that the temperature difference of the plasma emission source remains minimal during measurement.
1.2 Test conditions
The test subjects are traditional AC TIG arc welding and AC PPCA-TIG arc welding.
The shielding gas for TIG arc welding and the internal and external shielding gas for PPCA-TIG arc welding is 99.9% pure argon.
Chloride activator is used to remove the oxide film from the surface of aluminum alloy. The use of MnCl 2 as the activator powder significantly increases the penetration into the chloride, it is selected as the activator with a particle size of 100-200 mesh.
The welding base metal is 8mm 3003 aluminum alloy plate.
The Arc Spectrum Information Acquisition System is represented in Figure 2.
The spectrometer used is the AvaSpec-ULS3648-10-USB2, a digital fiber optic spectrometer from Avantes.
The location for acquiring spectrum information is shown in Figure 3.
The distance from the tip of the tungsten electrode to the acquisition site is 3mm (y=3mm).
The acquisition method employed is fixed point acquisition.

Before carrying out the test, clean the aluminum alloy surface with acetone to remove any oil stains. Then use a grinder to remove the oxide film from the surface.
Additionally, dry and heat the active agent to eliminate any crystalline water and absorbed water present in the substance.
When carrying out the test, start by opening the gas cylinder and cooling water circuit. Start the air flow meter to control the external air circuit and start the motor that controls the powder feeder. Make the bow and start transporting the powder. When the arc is stable, collect the arc spectrum information and use a USB-6215 data acquisition card to collect the arc voltage (as shown in Fig. 3).
After completing the test, turn off the arc and stop feeding the powder.
The process parameters for the PPCA-TIG welding test are as follows: welding current 160 A, arc length 4 mm, inner layer argon flow 12 L/min, outer layer argon flow 8 L/min and powder feeder motor. speed of 30 r/min.

2. Test results and analysis
2.1 Arc spectrum information
According to the Boltzmann mapping method, we selected six Argon II spectral lines in the range 445 to 480 nm and questioned the transition probability (A), statistical weight (g) and excited state energy (E) of the selected rows in the NIST Database. The selected spectral lines were then calibrated, as shown in Figure 4a.
Furthermore, Figure 4b displays the spectral information of the PPCA-TIG-MnCl2 arc in the range of 445 to 480 nm.
When comparing with Figure 4a, we observe that in addition to the corresponding spectral lines of Argon II, lines of Mn I (475.40 nm, 478.34 nm), Mn II (449.88 nm, 450.22 nm) and Cl II (476.86 nm).
This indicates that after MnCl 2 enters the arc with the external gas, fusion, evaporation, dissociation and ionization occur under the influence of the high arc temperature and strong electric field, producing Mn, Mn+, Cl and Cl particles. -.


Fig.4 Spectral information of the arc
2.2 Arc temperature measurement and calculation
For example, traditional AC TIG welding is used to process the data.
The intensity of the Ar Ⅱ spectral line at a specific time is shown in Table 1 (Fig. 4a).
The data in Table 1 is analyzed using the Boltzmann mapping method and a linear relationship between ln(εL/νAg) and E is obtained by fitting the data with relevant software, as illustrated in Fig. 1.
The result of the fit calculation is y = a + bx, where a = -31.935 7 ± 2.105 and b = -0.719 97 ± 0.104 26. The coefficient of determination, R 2 is 0.922 61.
The temperature at this point, calculated from the slope (-1/kBT), is 16,113 K, which is in close agreement with the temperature previously measured using traditional TIG DC arc welding.
Table 1 resistance of selected Ar II lines
| No. | Spectral line | Characteristic strength |
| 1 | 457.93 | 952.81 |
| two | 458.98 | 974.44 |
| 3 | 460.95 | 1102.13 |
| 4 | 465.79 | 1084.69 |
| 5 | 472.68 | 1396.38 |
| 6 | 473.59 | 1557.44 |

2.3 Effect of MnCl 2 introduction to AC PPCA-TIG welding arc
The most fundamental characteristic of the AC arc is its periodic fluctuation.
To accurately represent the changing process of the AC TIG arc over time, the current and voltage waveforms of the welding power source were measured and the spectral sampling time interval was determined.
The results are displayed in Figure 6.
The results indicate that the welding power source current waveform is a typical square wave, with a period of approximately 16.7 milliseconds and an EN to EP ratio of approximately 12.06 to 4.64.

Set the sampling interval for spectrum analysis to 2 milliseconds and gather spectral data for both the traditional AC TIG arc and the AC PPCA-TIG-MnCl2 arc. Extract six selected Ar Ⅱ spectral lines for temperature calculation over a period. The results are presented in Figure 7.
For these two arcs, the spectral intensity during the EN period is higher compared to that during the EP period. During the EN period, the arc is concentrated and its light is strong due to the high contraction of the arc. In contrast, during the EP period, the arc is widely dispersed and its light is weak.
The difference in the shape of the arc is due to the behavior of the cathodic spot during the EP period. The cathode point tends to look for parts of the molten pool that contain oxides, and as the oxides in the center of the pool have mostly been cleaned out, the cathode point moves to the edge of the pool, causing the attached arc to expand.
Furthermore, since the current during the EP period is the same as that during the EN period, the arc light weakens as its distribution range becomes larger.


Fig.7 Change in intensity of the spectral line
The periodic temperature of the traditional AC TIG arc and the AC PPCA-TIG-MnCl2 arc, calculated by the Boltzmann drawing method, is shown in Figure 8.
The average temperature of the traditional AC TIG arc during the EN period is 16,031 K, while it is 16,723 K during the EP period.
The difference between the two periods is 692 K, being the lowest average temperature in the EN period.
As the thermal power (P) of the arc is determined by the product of current (I) and voltage (U), it can be seen in Figure 6 that the current values during the EN period and the EP period are equal, while the voltage value during the EN period (17.9 V) is lower than that of the EP period (26.2 V). This results in greater heat generation during the EP period.
The difference in voltage values is due to the different mechanisms by which the tungsten electrode and the aluminum alloy emit electrons. During the EN period, the tungsten electrode, as a hot cathode material, emits electrons through thermal emission. At high temperatures, it is easier to emit electrons.
In contrast, during the EP period, aluminum alloy, as a cold cathode material, emits electrons through field emission, which requires a higher voltage to complete.
It is also noted that temperature is positively correlated with electron density. The average electron density, measured in the literature, is higher during the EP period compared to the EN period, which is consistent with the results obtained in this experiment.

For the AC PPCA-TIG-MnCl 2 arc, the average temperature during the EN period is 16,460 K, which is 429 K higher than that of the traditional AC TIG arc. The average temperature during the EP period is 17,056 K, 333 K higher than that of the traditional AC TIG arc.
The reason for the increase in temperature is due to the following factors:
Firstly, the MnCl 2 active powder enters the arc through the external gas. Under the influence of high temperature and strong electric field of the arc, dissociated Cl has high electron affinity. This results in the absorption of electrons at the periphery of the arc, causing the conductive channel at the center of the arc to narrow, the arc to shrink, and the current density of the plasma at the center of the arc to increase, leading to an increase in temperature.
Secondly, the evaporation and dissociation of the active agent powder and the flow of cold external gas consume a significant amount of arc heat. According to the principle of minimum voltage, the arc will shrink further, resulting in a further increase in the temperature of the center of the arc.
Figure 9 shows the TIG and PPCA-TIG-MnCl 2 arc voltage.

Based on the parameters of the PPCA-TIG welding process mentioned above, the welding test was carried out with a welding speed of 100 mm/min, and the weld surface formation and weld penetration of traditional AC TIG welding and AC PPCA-TIG welding using MnCl 2 active agent powder were compared.
As shown in Fig. 10, the penetration of AC PPCA-TIG-MnCl 2 welding reached 2.4 times that of traditional AC TIG welding, and good weld surface formation can be guaranteed at the same time.

3. Conclusion
(1) For AC TIG arc, the arc light in negative electrode (EN) mode is stronger compared to that in positive electrode (EP) mode. The arc voltage in EN is lower and the arc temperature is also lower when compared to EP.
(2) In AC pulsed plasma circular arc (PPCA) TIG welding, when MnCl 2 is used as active agent powder, it melts and evaporates in the process of arc dissociation and ionization.
Compared to traditional TIG welding, the central temperature of the arc and the voltage in the EN and EP sections are increased.
(3) When MnCl 2 is used as active agent powder in AC PPCA-TIG welding, it significantly increases the penetration compared with traditional AC TIG welding, while ensuring good weld surface formation.