Typically, SN curves obtained from manual testing are based on results from unnotched standard samples. However, actual parts used in real-world applications can have different shapes, sizes, surface conditions, working environments and loading characteristics, which can significantly impact the fatigue strength of parts.
Factors that affect fatigue resistance can be grouped into three categories: mechanics, metallurgy and environment. These factors are interdependent, making it difficult to comprehensively assess their impact on fatigue strength design and fatigue life prediction.
Mechanical factors are mainly influenced by stress concentration and mean stress. Metallurgical factors are related to the quality of the material, such as purity and resistance. Environmental factors, on the other hand, include the presence of corrosive substances and high temperatures.
For railway vehicle parts, which mainly operate under normal atmospheric conditions and normal temperatures, the main focus should be on mechanical and metallurgical factors, such as the influence of notch shape, size, surface condition and average stress.
Specific information about the influence of these factors on the fatigue limit can be found in relevant manuals and materials through the use of empirical formulas.
This article aims to discuss the important laws and phenomena that need to be understood in fatigue resistance design and fatigue life prediction, as well as the precautions that should or should be taken into consideration.
1. Notch shape effect
Parts or components often have notches such as boss steps, bolt holes, oil holes, keyways, etc. The defining characteristic of these notches is that the cross-sectional area of the parts undergoes a sudden change at the notch, causing the stress at the root of the notch to increase significantly. This increase in stress is known as stress concentration.
The stress concentration in the notch is the main factor responsible for reducing the fatigue resistance of the components. The stress concentration causes the actual stress at the root of the notch to be much greater than the nominal stress, leading to the formation of fatigue cracks and eventually resulting in part failure or damage.
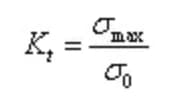
The extent of stress concentration is described by the stress concentration factor (also known as theoretical stress concentration factor) Kt, which is expressed as follows:

Here, σ max. represents the maximum stress, and σ 0 represents the average stress calculated by dividing the load by the net cross-sectional area in the notch, also known as the nominal stress.
Within a certain range, the smaller the radius of curvature ρ at the root of the notch, the greater the stress concentration and the greater the reduction in fatigue strength. However, for plastic materials such as low and medium carbon steel, as the radius of curvature at the root of the notch becomes smaller and approaches a few millimeters, the reduction in fatigue strength becomes smaller or even stops reducing. .
In this case, the stress concentration factor is no longer an accurate reflection of the notch's impact on fatigue strength. To more accurately reflect the true reduction in fatigue strength, the fatigue notch factor K f (formerly known as the effective stress concentration factor) is often used.

Here, σ w0 and σw represent the fatigue limits of smooth specimens without notches and specimens with notches, respectively.
The following figure illustrates the relationship between the stress concentration factor K t and the fatigue notch factor K f for steel.
As shown in the figure, for low and medium carbon steel, when the stress concentration factor is less than 2 to 2.5, K t and K f are generally similar. However, when this value is exceeded, the increase in K f decreases significantly.
For high carbon steel with high strength ratio, K f increases linearly with K t over a long range.
It can be concluded that the fatigue strength of high-strength steel is highly sensitive to the presence of notches, while the fatigue strength of low- and medium-strength steel is less sensitive to notches.

Generally, K f is less than K t but in case of sharp notches in high carbon steel, K t may be greater than K f . This can also occur in screw parts, where K t can reach 4 and K f can be 8 to 10. This is due to the uneven distribution of the load between the threads, with several loads concentrated on a single thread.
For smooth materials, surface heat treatments such as surface quenching, carburizing and nitriding can effectively improve their fatigue resistance. However, these methods may be ineffective or even reduce the fatigue strength of notched materials. This is because surface strength is improved through heat treatment, but notch sensitivity also increases.
The following figure illustrates the change in fatigue strength of high-strength notched steel and low-strength steel with good plasticity as the stress concentration increases. In the range of lower stress concentration K t , the fatigue strength of high-strength steel is significantly higher than that of low-strength steel. However, as the stress concentration factor increases, the fatigue strength of high-strength steel decreases faster than that of low-strength steel, resulting in the fatigue strength of high-strength steel being almost equal to that of low resistance steel.

For welded components, fatigue strength is often significantly reduced due to the combination of the heat-affected zone being located close to the structural notch and the presence of welding defects and residual tensile stress. This reduction can be several times greater than normal or even more than ten times.
The fatigue notch coefficient can also be affected by the size of the parts. As a general rule, for the same notch, the notch fatigue coefficient increases with increasing size.
To improve the fatigue life of notched materials or notched components, it is more effective to perform structural design and selection of processes that reduce or improve stress concentration.
However, a rough surface and large size can reduce the fatigue resistance of components.
2. Size effect of parts
The diameter of the sample used for fatigue testing is typically between 5 and 10 mm, which is much smaller than the actual size of the parts.
For components subjected to bending and torsional loads, fatigue strength decreases as size increases. However, for axial tension and compression loads, size has a minimal effect.
The influence of size on the fatigue limit is represented by the size influence coefficient (ε).

Here, σ d and σ d0 represent the fatigue limits of smooth samples of any size and standard size, respectively.
The size effect on high-strength steel is greater than that on low-strength steel, and the size effect is more pronounced for parts with rough surfaces.
The effect of size is mainly due to the impact of the state of the material structure and the stress gradient on the fatigue strength of larger components.
As the material size increases, it becomes more difficult to control the manufacturing process, and the material structure becomes less uniform and compact, with more metallurgical defects and a larger surface area, which increases the likelihood of these defects .
This results in an increased risk of fatigue and surface cracking of large samples. Local stress concentration caused by metallurgical defects leads to the formation of fatigue cracks.
Regarding the influence of the stress gradient, when subjected to bending, torsion and other loads, the larger the size of the component, the lower the working stress gradient, the greater the average stress per unit area and the easier it is for fatigue cracks to occur. will form.
3. Effect of surface condition
Surface conditions affect various factors such as surface roughness, surface stress state, degree of surface plastic deformation, surface defects and others.
In the testing process, the standard sample with a polished surface is used, however, the real parts usually have machined, forged or cast surfaces.
Machining can result in hardening of the plastic on the surface of the part.
Cutting often leaves residual compressive stresses on the surface, which improves fatigue resistance, but only to a certain extent.
Grinding, on the other hand, can cause residual tensile stress, which is detrimental to fatigue strength.
Furthermore, microscale roughness of machined surfaces can lead to stress concentration and decrease fatigue resistance.
The combined effect of these factors results in a lower fatigue resistance compared to the standard sample.
Forged or cast surfaces typically exhibit increased roughness and surface hardening layers, as well as compressive residual stresses, leading to a significant decrease in fatigue strength.
In conclusion, the rougher the surface processing method, the greater its impact on reducing fatigue resistance.
The effect of surface processing conditions on fatigue resistance is represented by the surface processing coefficient (β).

Here, σ β represents the fatigue limit of a standard smooth sample at a certain surface state, σ β0 represents the fatigue limit of a standard smooth polished sample, and “abroad” refers to the standard smooth sample with a polished surface.
From a metallurgical point of view, rough machining has a significant impact on the fatigue resistance of high-strength materials; therefore, high-strength steel may not increase fatigue resistance in rough machining states. This is mainly due to the high notch sensitivity of high-strength materials to rough surfaces and the minimal hardening effect of machining on the surface of high-strength steel.
Little research has been done on the impact of surface defects, such as surface decarburization, surface collision marks and scratches, on fatigue resistance. However, surface defects caused by accidental reasons can have a significant impact on fatigue resistance. Therefore, sufficient attention must be paid to these issues in the design and especially in the manufacturing process.
For smooth materials, surface heat treatment and other surface modification methods can improve fatigue resistance. However, for materials with notches, such as real parts, these methods have little effect and may even have an adverse effect. As a result, shot peening and rolling are often used to generate work hardening and residual compressive stress on the surface, thereby improving the fatigue resistance of components.
However, these two methods generally do not significantly improve the fatigue strength of parts with holes. The latest research shows that using a simple metal die to chamfer a small part of the hole edge can significantly improve fatigue resistance and even eliminate notch impact, reducing the fatigue limit.
In the past, it was commonly believed that the main reason for the improvement in fatigue resistance of plastic surface processing methods was due to the residual compressive stress generated on the surface compensating for part of the working stress.
However, the concentrated compressive stress produced by the residual compressive stress in the notch compensated for the adverse effect of the notch. Plastic deformation strengthens weak areas near the notch, making the structure more uniform and improving overall strength, which in turn improves the stress level that produces fatigue cracks.
Furthermore, residual compressive stress causes fatigue cracks to stop growing and become permanent cracks.
4. Effect of average stress
As stated previously, the main cause of fatigue failure is dynamic stress, but the static stress component, or mean stress, also has some impact on the fatigue limit. In a specific range of static stress, an increase in static compressive stress will increase the fatigue limit, while an increase in static tensile stress will reduce it.
It is widely accepted that residual stress has a similar effect on fatigue limit as mean stress. For a given material, a fatigue limit diagram can be drawn based on its fatigue limit results under different mean stresses or strain rates (R).
The diagram below presents a dimensionless quantity, the ratio between the average stress (σ i ) or residual stress, up to the strength limit (σ b ), on the x axis, and the ratio of the stress amplitude (σ a ) to the strength limit. symmetric cyclic fatigue (σ -1 ), on the y-axis.

The figure shows that most test data points fall between straight and curved lines. The straight line is called the Goodman line, while the curve is known as the Gerber parabola. The Soderberg line is obtained by replacing the strength limit (σ b ) with the yield limit (σ e ). Similarly, the Morrow line is derived by replacing σb with the true fracture stress (σ f ).
Goodman Line:

Gerber Line:

Soderberg Line:

Line tomorrow:

The Goodman line is a conservative and straightforward approach to ductile metals, making it a widely used method in fatigue design. Another frequently used method is Goodman's Improved Ideal Diagram.
The following figure illustrates the improved ideal Goodman diagram of an I-shaped steel beam under bending fatigue loading. The x-axis represents the minimum stress (σ min ), the y-axis represents the maximum stress (σ max ), and the linear equation is as follows:

Where m is the slope of the Goodman line, b is the intercept of the line on the y axis, and is the fatigue limit of the pulsation cycle when the minimum stress is equal to zero.
When the fatigue limit is expressed by the maximum stress, namely σ c = σ Max. considering the stress ratio R= σ max. /σ Minimum .
The Morrow line includes:


The fatigue limit for a given stress ratio (R) can be calculated using the above formula. However, the actual structure of a vehicle is much more complex than the test conditions under which the SN curve was obtained, such as the type of welding and stress concentrations.
The American AAR standard provides valuable guidance for the fatigue strength of various welding structures, and therefore the values of “b” and “m” in the actual calculations are taken from the AAR standard.
The test results indicate that the impact of static load components on the stress concentration coefficient, dimension coefficient and surface coefficient is minor and can be disregarded.

