1. Introduction
In engineering practice, there are two commonly used methods to evaluate the straightness error of guide rails: the two-end connection method and the minimum condition method.
The two-end point connection method connects the error curve end-to-end, and then draws two lines parallel to the end-to-end line at the highest and lowest points of the curve and measures the values along the vertical axis between two parallel lines.
After data processing, the value is the straightness error of the guide rail.
The minimum condition method connects the “high, high” (or “low, low”) points of the error curve and draws a line parallel to it through the low (high) point.
The value measured between the two parallel lines along the vertical axis is the straightness error of the guide rail after data processing.
The minimum condition method is an arbitration assessment.
The two endpoint connection method is not an arbitration evaluation, but is commonly used in production due to its simplicity and convenience in evaluation, although it can sometimes produce large errors.
This article discusses the threshold value of the error generated between these two evaluation methods.
2. The error curve is on the same side as both ends of the line
By measuring the straightness error of a certain hydraulic slide rail guide model, the straightness error curve was obtained as shown in Figure 1.
As can be seen from the figure, the error curve is on the same side of both ends of the line.
Below, the straightness error value of the guide rail will be evaluated using the minimum condition method and the two-end connection method.

(1) Evaluation of straightness error using the minimum condition method
According to the minimum condition method, the lowest points 1 and 2 of the curve in Figure 1 (with the lowest point 1 coinciding with the origin) are connected by the line a1a1 as shown in Figure 2.
The parallel line a2a2 is drawn through the highest point 3 relative to the line a1a1.
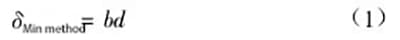
The value measured along the y axis in the region delimited by the two parallel lines a1a1 and a2a2, after data processing, represents the straightness error of the guide rail δ obtained by the minimum condition method.
(2) Evaluation of straightness error using two-end connection method
According to the two-end connection method, the ends of the curve in Figure 1 are also the end points 1 and 2 of the curve, as shown in Figure 3.
End points 1 and 2 are connected by line b1b1, and then a parallel line b2b2 is drawn through the highest point.
The value measured along the y axis in the region delimited by the two parallel lines b1b1 and b2b2, after data processing, represents the straightness error of the guide rail δ obtained by the two-end connection method.


(3) Determination of the error limit generated by the two evaluation methods
Since both evaluation methods are used to determine the straightness error of the same guide rail, the “low point 1”, “low point 2” and “high point 3” in Figure 2 respectively correspond to the “end point 1” , “full stitch 2” and “double stitch 3” in Figure 3. This makes line a1a1 coincide with line b1b1 and line a2a2 coincide with line b2b2.
Therefore, the error value generated by the two evaluation methods is zero.

Based on the above analysis, when the error curve is on the same side of both ends of the line, the error limit generated by the two evaluation methods is zero, which means that the evaluation results obtained by the two methods are the same.
3. The error curve is on both sides of the line connecting the ends
In the measured straightness error curve of a guide rail, some error curves are on both sides of the line connecting the ends, as shown in Figure 4.
The error curve of this guide rail has a line connecting its ends coinciding with the x axis. The straightness error of the guide rail will be evaluated using the minimum condition method and the two-end connection method.
As can be seen in Figure 4, points o and c are the two low points and the two end points of the curve, while point d is the highest point.

According to the minimum condition method, points o and c are connected by line a1a1 as shown in Figure 5. Line a2a2 is drawn parallel to line a1a1 through the highest point d.
The value measured along the y axis in the region delimited by the two parallel lines a1a1 and a2a2, after data processing, represents the straightness error of the guide rail δ obtained by the minimum condition method.

According to the two-point connection method, draw two lines parallel to the x-axis passing through points C and D respectively.
These lines are represented by the dotted lines b1b1 and b2b2 in Figure 5. In the region delimited by these two parallel lines, the value measured along the y axis, after data processing, represents the value of the straightness error of the guide rail between both ends points.
To determine the minimum deviation method and the deviation value at the two endpoints, draw a line parallel to the y-axis through point D, crossing the axis at point A, crossing line a1a1 at point H, and crossing line b1b1 at point F.
Similarly, draw a line parallel to the y-axis through point C, crossing the axis at point E.
(1) Determination of straightness error using the minimum condition method
According to the minimum condition method, the straightness error value δ of the guide rail is derived from the value measured along the y axis after data processing, which represents the minimum deviation method.
As shown in Figure 5:
And since BD = BA + AD,

∆OAB and ∆OEC are two similar triangles, therefore,

Rearranging equation (3), we obtain:

Substituting equation (4) into equation (2) and rearranging, we obtain:

(2) Determination of straightness error using two-point connection method
According to the two-point connection method, the value measured along the y-axis after data processing represents the straightness error value δ of the guide rail between the two end points.
As shown in Figure 5:

And since fa = ce,

(3) Calculation of error values generated by two evaluation methods
Equation (6) minus equation (5), i.e.

Rearranging, we obtain:

(4) Calculation of the maximum error generated by two evaluation methods
In Figure 5, let ad = δ1, ce = δ2, oa = p; let the length of the guide rail being measured be lo, then oe = l – p, e:

For example, when p = 0.5m (i.e., the pitch is 0.5m), δ1 = 1.0δ, δ2 = 0.25δ, and the measured guide rail length is l – 2m, then the error ratio generated by the two evaluation methods is:

The error ratio generated by the two evaluation methods is 0.154, which means that the error generated by the two-point connection method is 15.4% greater than that generated by the minimum condition method.
In the above equation, when ![]() that is, the highest and lowest points of the error curve are infinitely far from each other, so
that is, the highest and lowest points of the error curve are infinitely far from each other, so ![]() then we get:
then we get:

For example, when δ1 = 1.0δ and δ2 = 0.25δ and the distance between the highest and lowest points of the error curve is infinitely far apart (i.e. L = 0.25), then the generated error ratio by both evaluation methods is ![]() which means that the error generated by the two-point connection method is 25% greater than that generated by the minimum condition method.
which means that the error generated by the two-point connection method is 25% greater than that generated by the minimum condition method.
When δ1 = δ2, that is, the distance between the highest and lowest points of the error curve is equal, as shown in Figure 6, then the maximum error values generated by the two evaluation methods are:
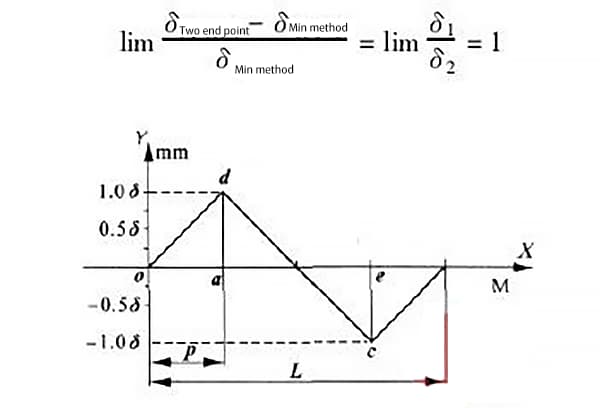
From this, it can be seen that when the highest and lowest points of the guide rail are equal and infinitely far from each other, the maximum error generated by the two evaluation methods is the largest and can reach 100%.
Table 1 lists the proportion of errors generated by the two evaluation methods for different lengths of the measured guide rail, when the error curve points are distributed on both sides of the two-point connection line.
The distance between the highest and lowest points of the error curve is equal when the measurement step p = 0.5.
Table 1 Error ratio of the two evaluation methods
| Error rate | Distance L (M) between the highest and lowest points of the guide rail | ||||||
| 1 | 10 | 15 | 20 | 25 | 30 | 40 | ∞ |
| 33.30% | 90% | 93.30% | 95% | 96% | 96.70% | 97.50% | |
4. Conclusion
If the points of the straightness error curve are on the same side of the connecting line of two points, then the errors generated by the two evaluation methods are zero, that is, the results obtained by the two evaluation methods are the same.
If the points on the straightness error curve are on both sides of the connecting line of two points, and the highest and lowest points of the error curve are equal and infinitely far apart, then the maximum error generated by the two evaluation methods is the largest, and the error generated by the two-point connection method can be 100% greater than that generated by the minimum condition method.
Therefore, when evaluating the straightness error of guide rails of large machine tools in practical production, it is very important to choose the appropriate evaluation method. When the points on the error curve are on both sides of the connecting line of two points, the minimum condition method should be used as the first choice for evaluation.