Background Description:
Recently, a group of springs from a company broke during testing. The spring manufacturing process involves cooling heat treatment, grinding, curved forming, pre-shot peening, gas nitriding, shot peening and hot setting.
An analysis was carried out to determine the reason for the cracking of the broken spring.
Test method and equipment
Test content: macromorphological analysis;
Test Equipment:
- M250 stereomicroscope;
- DM6000 metallographic microscope;
- ZEISS EVO18 scanning electron microscope;
- ZEISS EVO18 energy spectrometer.
Test result
Macroscopic morphological analysis
After testing three samples marked after spring, they were identified as sample #4, sample #3 and sample #3, as recorded. Figure 1 shows that all three samples suffered fatigue fracture.
Based on the flatness of the fracture surface and the area of the instantaneous fracture zone, it can be concluded that sample #4 suffered the initial fracture, followed by sample #3, and finally sample #3 again.
The light spring yellow color is the result of nitriding treatment. Nitriding treatment is a chemical heat treatment process that involves allowing nitrogen atoms to penetrate the surface layer of the workpiece in a specific medium at a specific temperature. Parts that undergo nitriding treatment have excellent wear resistance, fatigue resistance, corrosion resistance and high temperature resistance.
The spring fracture is located at the source of fatigue and has a bright white appearance. Due to the wear of the nitride layer, the fatigue strength of the surface is reduced, leading to fatigue cracking.
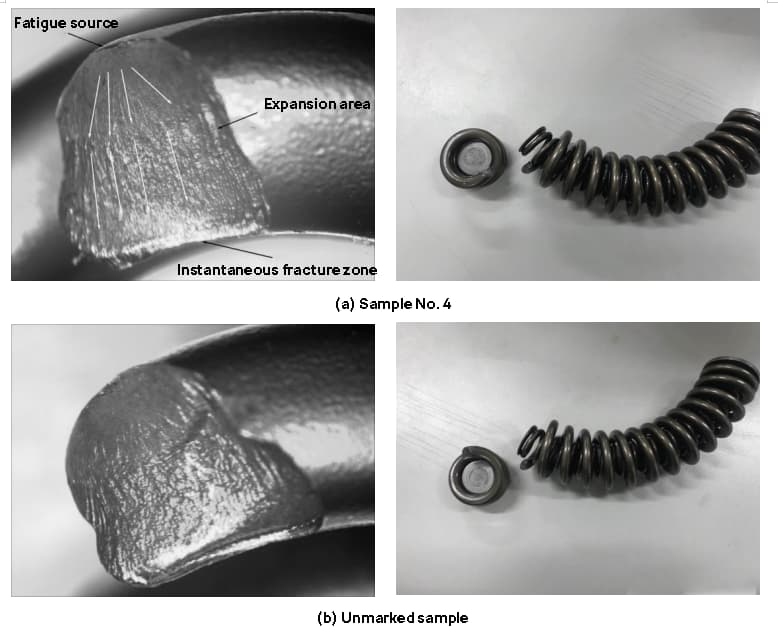
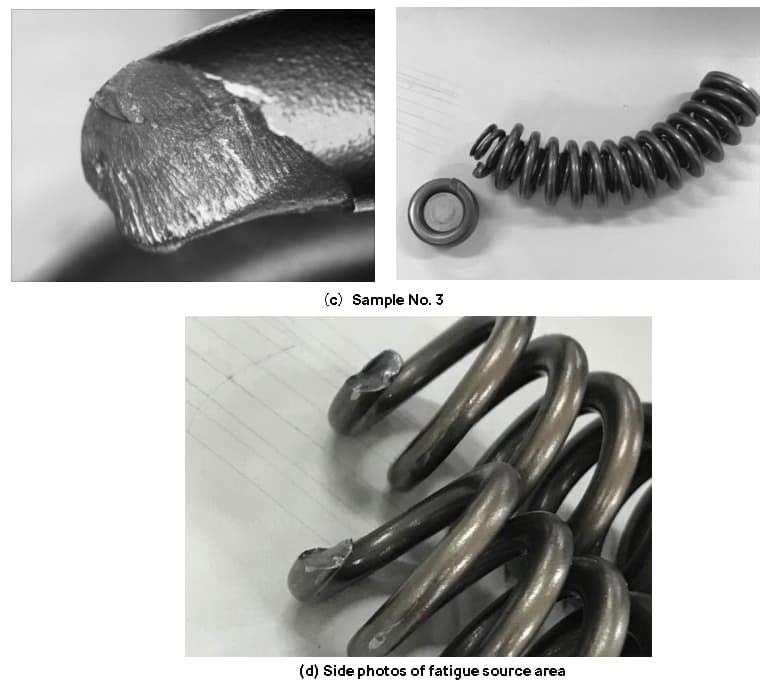
Fig. 1 Macro photo of broken spring fracture
Metallographic microstructure analysis
See Fig. 2 for the metallographic micrograph showing the cross section of the broken spring.
As depicted in Fig. 2, there is a thin white nitrided layer on the surface of the spring, which appears to be wavy and uneven in thickness.
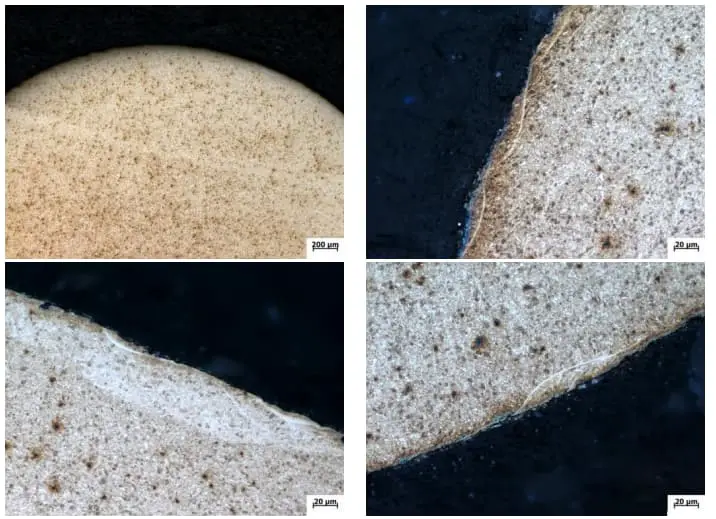
Fig. 2 Metallographic micrograph of the fracture spring cross section
See Fig. 3 for the metallographic micrograph of the longitudinal section of the broken spring.
In Figure 3, it can be seen that there is a white nitrided layer on the surface of the spring and an obvious stripe structure.
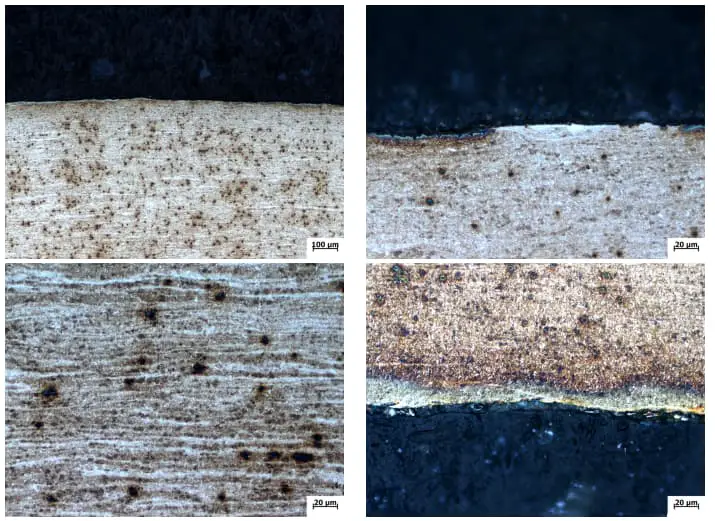
Fig. 3 Metallographic micrograph of the longitudinal section of the fracture spring
See Fig. 4 for metallographic micrograph of spring cross-section through fatigue testing.
In Figure 4, it can be seen that there are white pulse-like structures on the surface of the spring through the fatigue test.
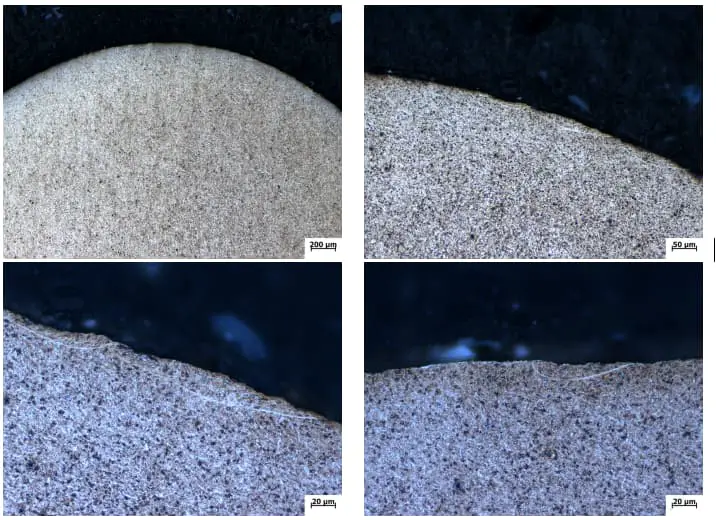
Fig. 4 Metallographic micrograph of the spring cross section through the fatigue test
The vein structure is a type of nitride network formed through high temperatures, nitrogen potential, or prolonged nitriding time.
As the nitriding layer on the spring parts is extremely thin, any adverse effects from a prolonged process can be minimized.
The likely cause of such effects may be excessively high nitriding temperatures or nitrogen potentials.
The presence of a vein structure may decrease the fatigue resistance of the nitriding layer.
Microhardness Test
The surface microhardness test results of the spring show that the surface microhardness of the spring is about 560hv and the core microhardness is about 510HV.
SEM analysis of the fracture surface
Figure 5 shows the SEM micrograph of the spring fracture.
Based on the micrograph, it is evident that the fracture is the result of fatigue and began on the external surface of the spring.
The fatigue expansion zone is relatively small, making up only about 20% of the fracture.
Beyond the zone of fatigue expansion, a region of rapid expansion follows.
This area exhibits an unstable herringbone pattern and rapidly expanding local fatigue bands.
Scratch marks and holes are visible at the origin of the spring fracture, indicating that they are the main cause of the fracture.
Furthermore, there are spherical particles present in the fracture source region.
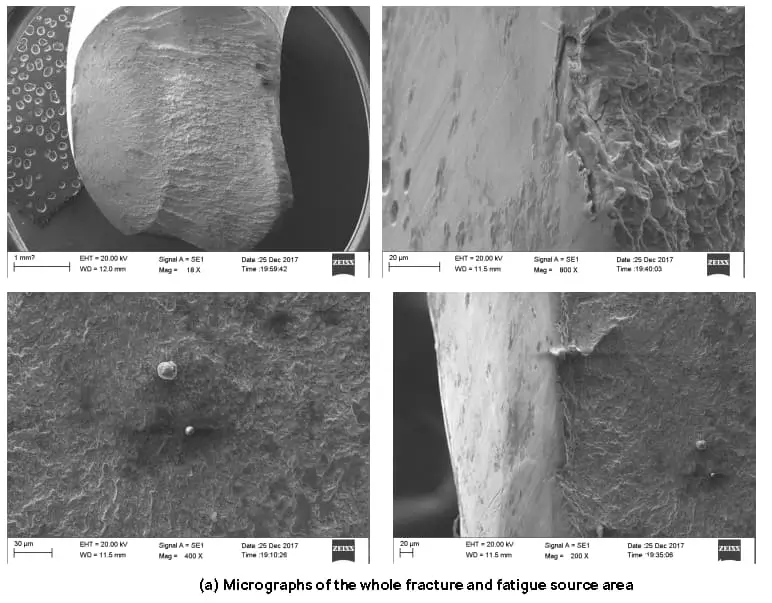
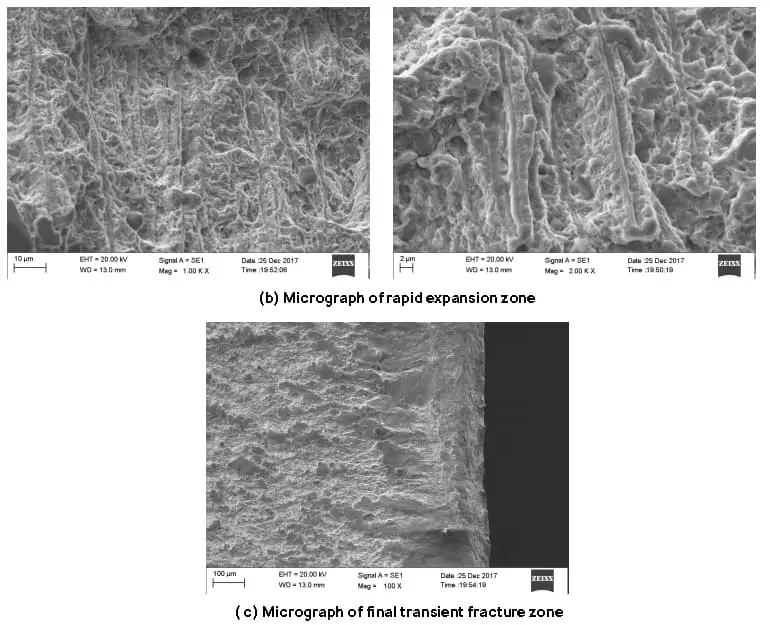
Fig. 5 SEM micrograph of the fracture spring
Analysis of the chemical composition of fractographic particles by EDS
To examine the origin of the fracture particles, we performed a microarea composition analysis using the EDS energy spectrum.
The results of the analysis reveal that the primary elements in the particles are Mo and Cr, which may indicate the presence of lubricants in the lubricating oil.
Table 1 Results of EDS energy spectrum analysis of particulate matter (%)
| element | % by weight |
| C.K. | 3.83 |
| OK | 4.07 |
| CrK | 8.77 |
| FeK | 56.28 |
| Nick | 3.85 |
| MoL | 11:20 p.m. |
| total | 100 |
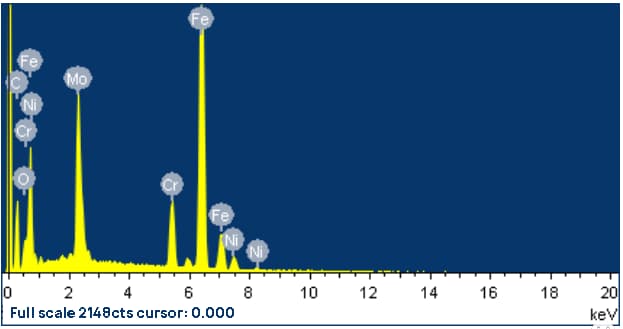
Fig. 6 Results of EDS energy spectrum analysis of particulate matter
Table 2 Results of 2EDS energy spectrum analysis of particulate matter (%)
| element | % by weight |
| C.K. | 2.28 |
| OK | 4:35 p.m. |
| CrK | 3.83 |
| MnK | 0.46 |
| FeK | 38.49 |
| Nick | 38.59 |
| total | 100.00 |
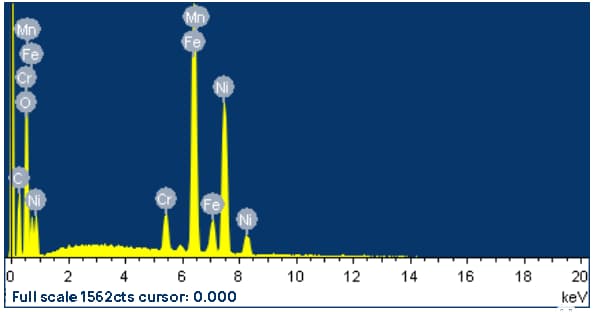
Fig. 7 Results of 2EDS energy spectrum analysis of particulate matter
Conclusion
The fracture mode of the spring is fatigue fracture.
The source of fatigue from the broken spring appears to be wear, as indicated by the bright white appearance and worn nitride layer. This wear reduced the fatigue strength of the surface, resulting in fatigue cracks.
The presence of a pulse-like structure on the surface will also contribute to reducing the fatigue resistance of the material.