The press brake is the most commonly used bending equipment in sheet metal processing and plays a crucial role in the process.
The CNC press brake is capable of producing bent parts in different shapes, lighter than rolled profiles and with an attractive appearance.
Welded components made from bent parts are also 30% to 50% lighter than the same type of steel casting. The manufacturing process is simple and the production efficiency is high.
However, the worktable of the press brake inevitably undergoes downward elastic deformation due to the lack of rigidity when bending the plate.
As a result, the die installed at the upper end of the work table undergoes the same deformation, leading to a reduction in the depth of the upper die to the lower die and an uneven distribution of pressure between the dies during bending.
The pressure at both ends of the die along the length direction is greater than that in the middle, resulting in a larger bend angle in the middle than at both ends and worse straightness in the middle than at both ends.
Therefore, it is necessary to take corresponding measures in the design of the press brake to compensate or reduce bending deformation.
To study this phenomenon, a CNC press brake is taken as the research object, using finite element theory and experimental tests.
1. Elastic analysis of work table deformation
The machining accuracy of the press brake mainly depends on the bending deformation of the sliding block and the work table.
In this section, we analyze the deformation of the work table using the theory of elasticity. We assume that the length and height of the work table are leh, respectively, and the upper limit of the work table experiences a uniform load g.
The work table is supported at both ends and the support reaction acts on it in the form of shear force distributed in the sections at both ends. We neglect the small influence of self-weight and use the semi-inverse method to solve the deformation of the work table.
Figure 1 illustrates the elastic model.
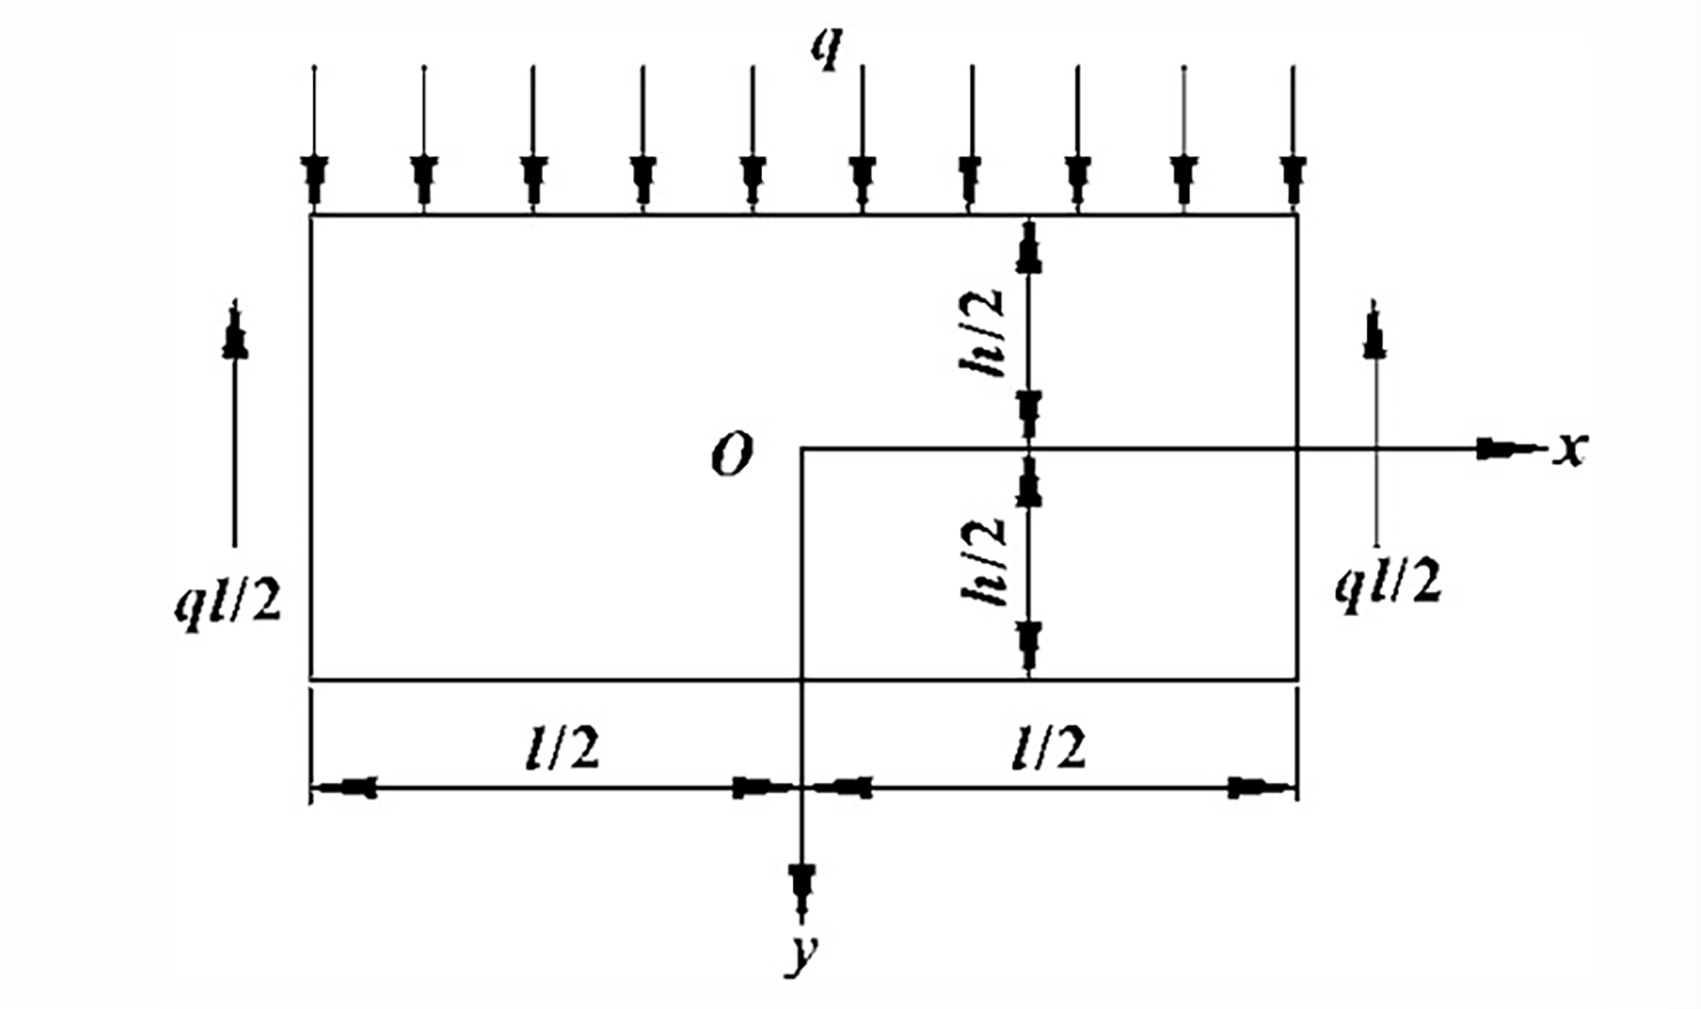
Fig. 1 Uniform load on the work table
The calculation process is explained in detail in the elastic mechanics book. The results are presented directly, and the deformation curve of the upper edge of the rectangular plate is obtained as follows:
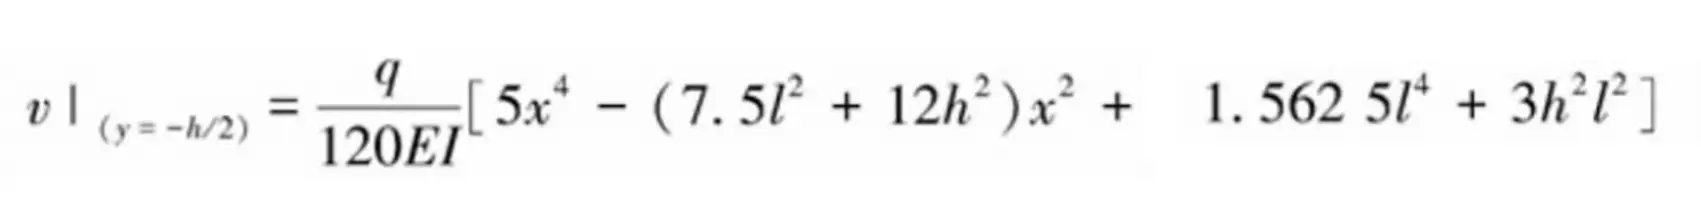
It is evident from the functional expression that the deformation occurring in the rectangular plate is a quadratic curve. This deflection deformation is the main cause of the plate's low processing accuracy.
2. Working table deflection compensation principle
The bending quality is often reduced due to the elastic deformation of the work table.
Currently, most CNC press brakes are driven types, with the worktable remaining static during the bending process. However, the press brake examined in this article is a top-drive type.
Due to the structure and transmission mode of the machine tool, it is more convenient and easier to compensate the hydraulic pressure of the work table.
The compensation principle involves arranging several hydraulic cylinders in the middle of the work table.
During the bending process, the front and rear vertical plates support compensating hydraulic cylinders, which provide upward force to the neutral plate. This overcomes the bending deformation of the work table.
The compensation value can be easily adjusted using the proportional pressure reducing valve, and the convex device is controlled by the numerical control system.
This allows the pre-convex amount to be determined based on the bending mode, plate thickness, die opening, and material properties during bending. Figure 2 shows this in detail.
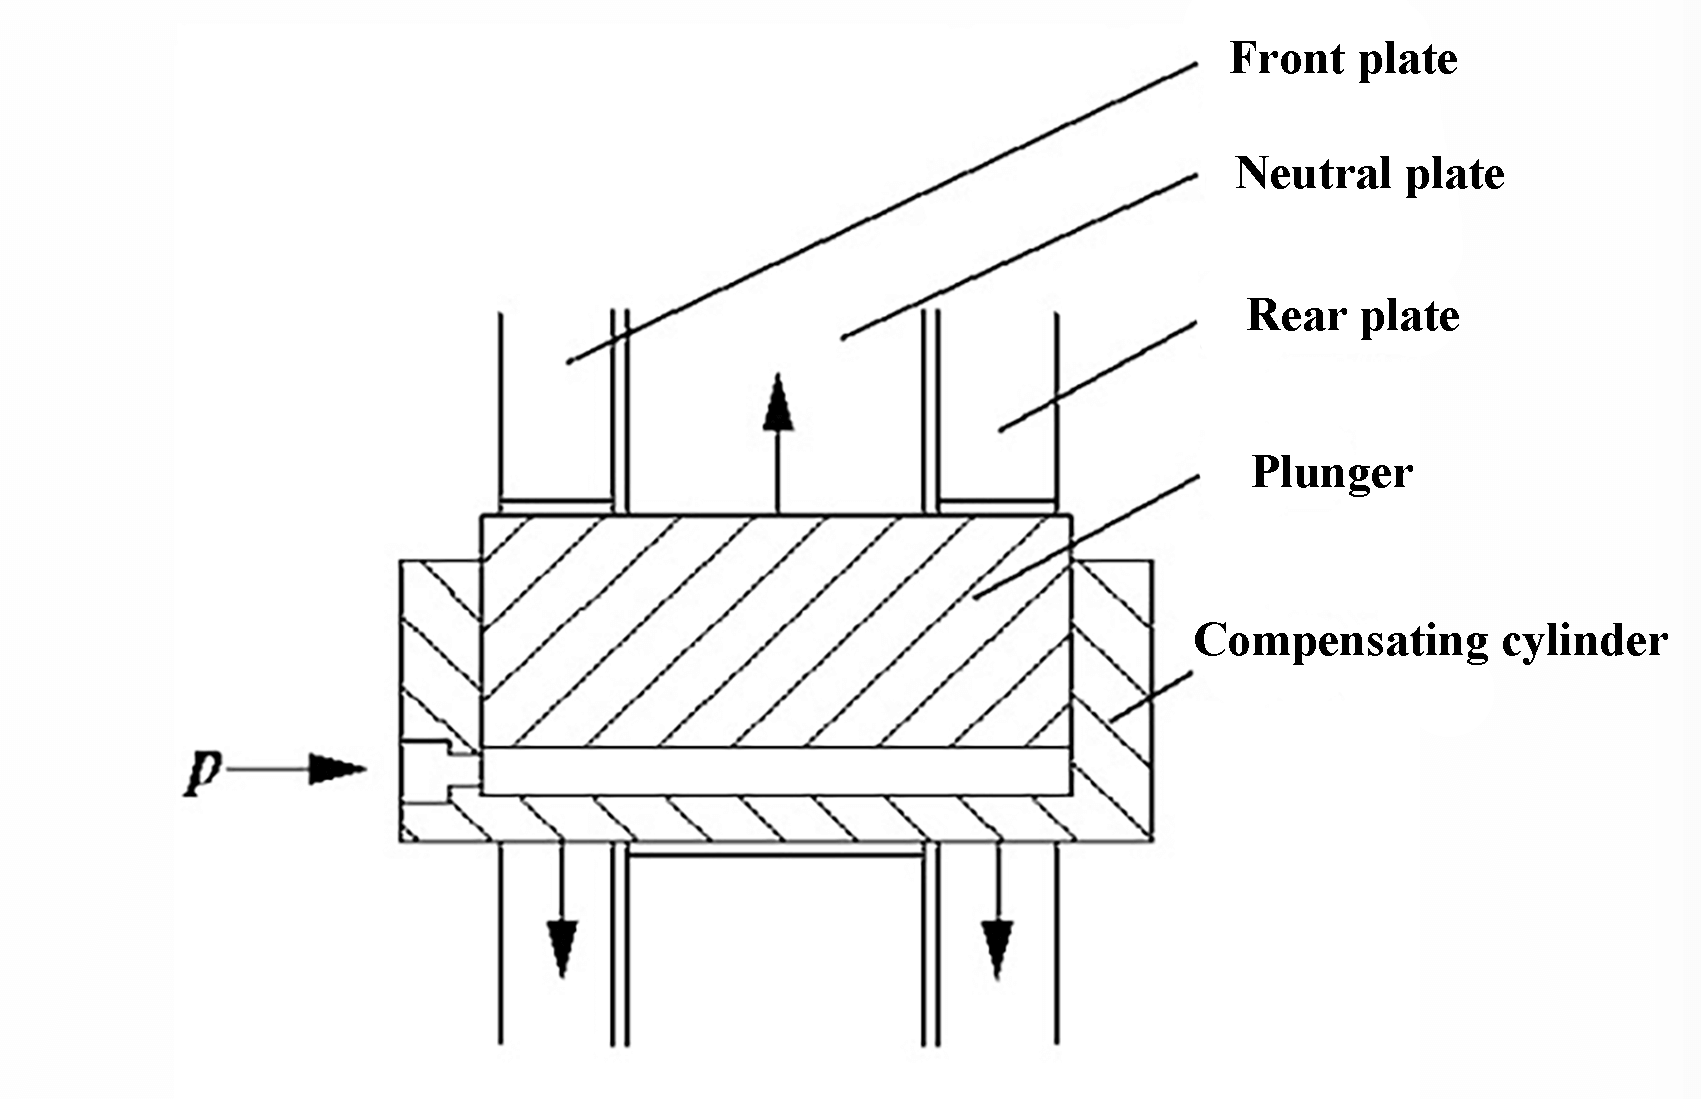
Fig. 2 Schematic diagram of the pressure compensation structure
The use of hydraulic principles in pressure compensation allows the compensation value to be increased with increasing load.
This feature, along with its easy adjustment, makes pressure compensation a popular choice for improving machining accuracy on CNC press brakes.
3. Finite element analysis and test of press brake
3.1. Brief introduction to finite element analysis
After performing a finite element analysis and optimization of the slider and side plate of the press brake, the machine structure was partially optimized to eliminate stress concentration.
Despite the optimization, the overall size of the machine remains unchanged.
In this section, we will not repeat the finite element model simplification, boundary condition constraints, load application and other contents.
Press brakes can have two ways of bending: with crowning and without crowning. They can also be divided into two forms based on the bending method: coining and air bending. Typically, the most commonly used form is air bending with crowning.
Due to limitations on article length and workload, we will present only two typical working conditions here. The first working condition involves full load (110 t) and coining and bending without crowning, while the second working condition involves full load (110 t), air bending and maximum compensation pressure of 25 MPa.
It is worth mentioning that the pressure on the loading surface corresponding to the front and rear vertical plates is 43 MPa.
3.2 Analysis results
The results of the stress calculation obtained from the finite element analysis are presented in Table 1, while the results of the displacement calculation are presented in Table 2.
Table 1 Results of partial stress calculation in MPa finite elements
| Working condition | Maximum upper throat stress | Maximum circular arc stress on slider shoulder | Maximum stress at the junction of the work table and side plate |
| Working Condition 2 | 178 | 270 | 138 |
Table 2 Finite element partial displacement calculation results
| Working condition | Top end face of neutral plate Vertical relative displacement |
Lower end face of slider Vertical relative displacement |
||
|---|---|---|---|---|
| Maximum value /mm | Occur position | Maximum value /mm | Occur position | |
| Working Condition 1 | -0.521 | Middle of the upper face | 0.428 | Middle of the lower face |
| Working Condition 2 | 0.597 | Middle of the upper face | 0.439 | Middle of the lower face |
3.3 Experimental test and comparison of results
To confirm the accuracy of the finite element calculation, an on-site test is carried out on the press brake structure.
Stress in the crucial components of the press brake is tested using a resistance strain gauge, while the displacement sensor is used as a measuring tool to determine the deformation of the press brake.
Figure 3 illustrates some of the experimental test sites.
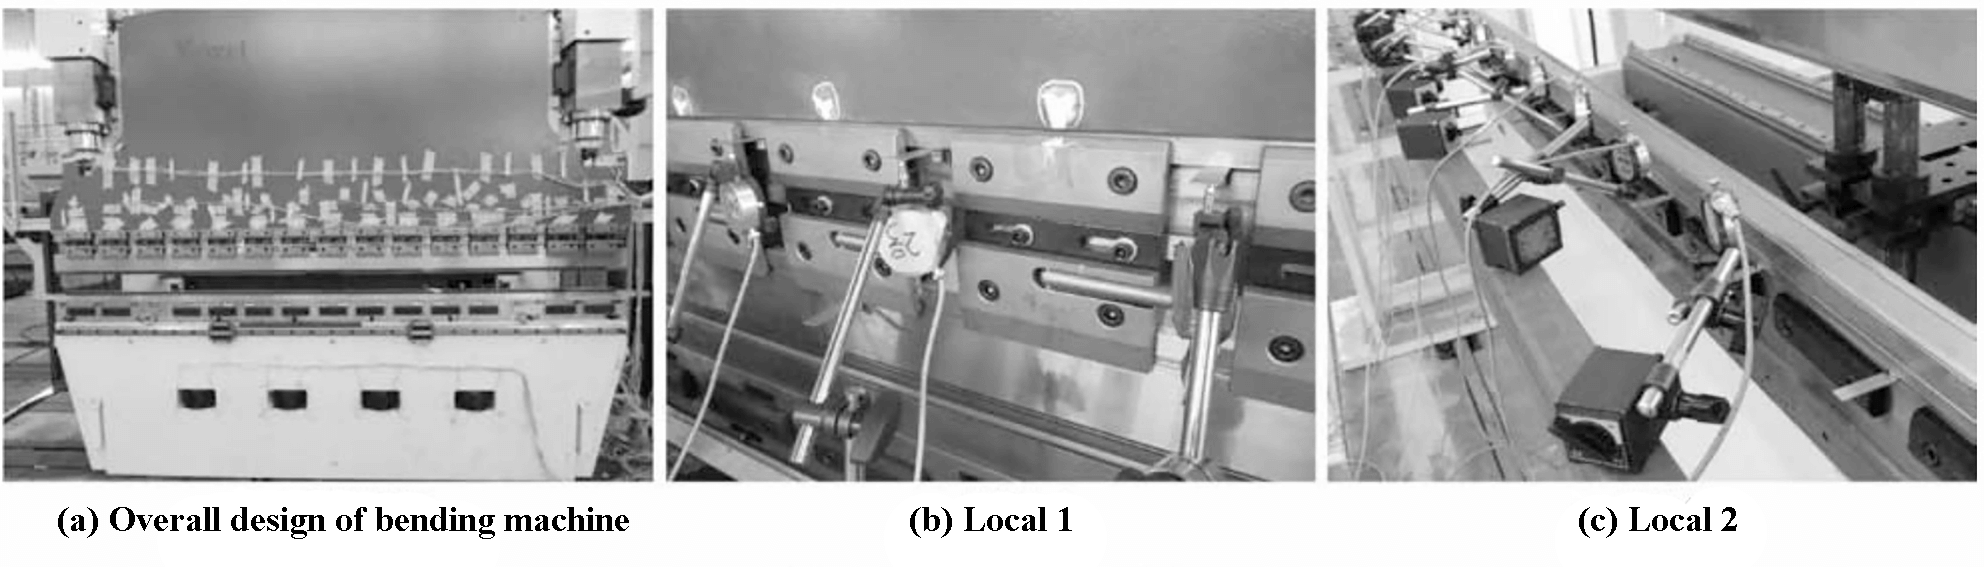
Fig.3 Some photos of the test site
The conclusions in Tables 3 and 4 reveal that:
- The experimental results are generally in agreement with the finite element calculation results.
- The voltage measurement error is less than 10% in some cases.
- The vertical deformation of the slider is comparable to the calculation results.
Table 3 Comparison of partial tension results
| Working Condition 2 | Testing Stress /MPa |
Finite Element Analysis Stress /MPa |
Relative error /% |
| Side plate upper throat | 183 | 178 | 2.8 |
| Sliding shoulder arch | 261 | 270 | 3.3 |
| Connection between side plate and work table | 126 | 138 | 8.7 |
Table 4 Comparison of partial displacement results mm
| Working Condition 2 | Maximum test displacement | Finite element displacement analysis | |
|---|---|---|---|
| The vertical relative deformation of the lower end of the slider | Total load length | 0.390 | 0.439 |
| The upper end of the work table is vertical and relatively deformed | Total load length | 0.236 | 0.597 |
During the testing process, compensation is automatically given and provided by the CNC system.
In working condition 2, the actual compensation is 0.34 mm, while the maximum compensation of the machine tool is 0.60 mm.
However, in finite element calculation, the exact compensation pressure cannot be determined accurately, so the maximum compensation pressure is used in the calculation process.
This explains the difference between the test results and the finite element calculation results of the upper end of the worktable.
By comparing the results, the accuracy of the finite element model is basically confirmed, providing the basis for the subsequent use of finite element software to compensate and optimize the deflection of the work table.
4. Research on hydraulic compensation technology
4.1 Functional analysis of the compensation cylinder
To improve machining accuracy, a hydraulic compensation device is designed to make the worktable deform upward and compensate for the deformation of the slider.
However, determining the optimal compensation pressure, position and number of cylinders is a critical optimization problem.
The optimization design module in ANSYS Workbench can describe the relationship between design variables and product performance and modify parameters in the generated parameter workspace.
The design point table can quickly run various analysis schemes and allow you to enter the design parameter value range on a new line for new design points.
After defining all the calculation points, updating them and executing the program, the calculation results of the sample calculation points are obtained.
The optimization of worktable compensation is based on the typical working condition of working condition 2, where the entire length of the worktable is loaded uniformly.
Maximum vertical deformation occurs in the middle of the bottom face when the slider is fully loaded.
The maximum vertical deformation of the top face of the work table also occurs in the middle. Figure 4 shows a comparison of the press brake deflection curve.
The comparison reveals that the maximum vertical deformation of the lower end of the slider is 0.39 mm, while that of the upper end of the work table is 0.236 mm.
During the field test, the CNC system automatically provided a compensation of 0.34 mm according to the bending parameters, indicating that the compensation given by the CNC system is too small.
However, the finite element calculation revealed that the maximum deformation of the lower end of the slider is 0.439 mm and that of the upper end of the work table is 0.597 mm, indicating that the total load compensation is too large in calculating the finite elements.
Therefore, the compensation pressure must be reduced.
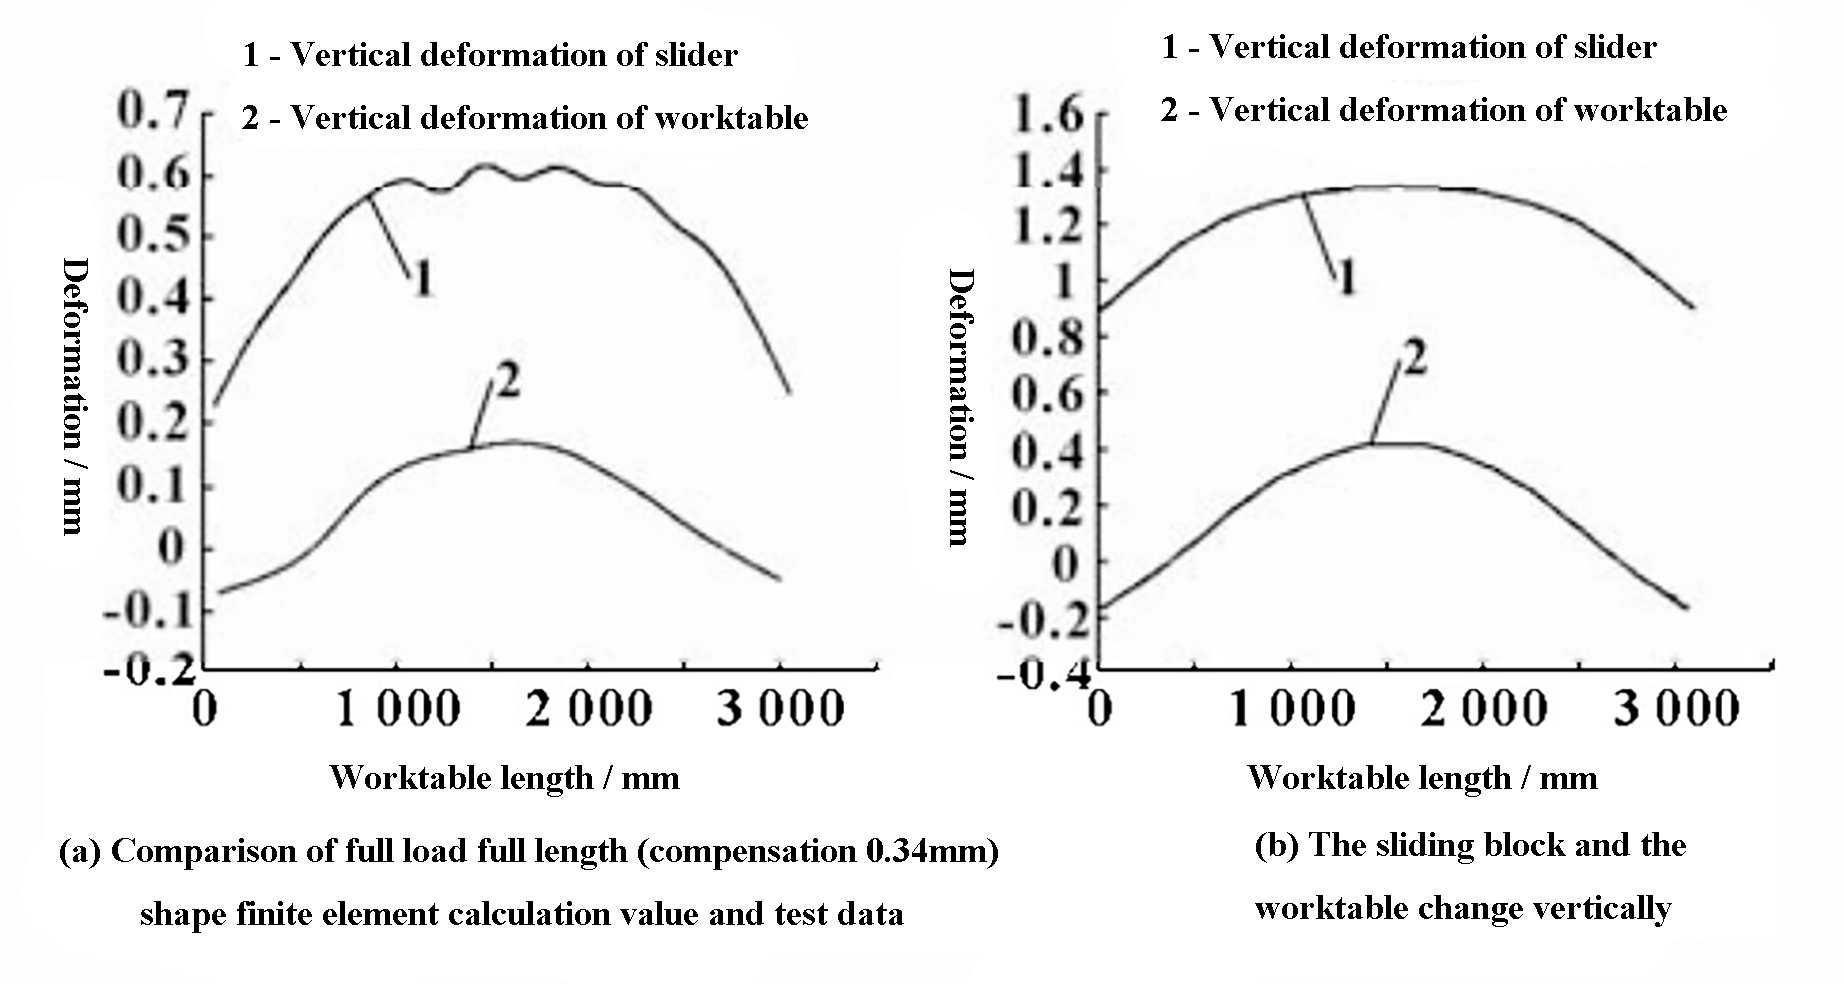
Fig. 4 Comparison of vertical deformation between the sliding block and the work table
Based on the above analysis, the conclusion is that the compensation calculated by the original numerical control system is very small, while the total load compensation in the finite element calculation is very large.
Therefore, it is crucial to optimize remuneration calculation.
4.2 Optimization analysis of compensation cylinder effect
An ANSYS Workbench model for press brake was established using a parametric approach.
In this model, V represents the compensation cylinder spacing and its initial value is set at 500 mm.
H denotes the distance between the base of the oil cylinder and the bottom of the work table, with an initial value of 336 mm. The maximum compensation pressure for the cylinder is 25 MPa.
To facilitate the optimization calculation, the cylinder pressure is converted to the actual pressure on the loading surface. For example, when the vertical plate thickness is 60mm, the conversion rate is 1.955.
In other words, the compensation pressure P is equal to the actual loading surface pressure P 1 /1.955.
The parameters are shown in Figure 5 for reference.
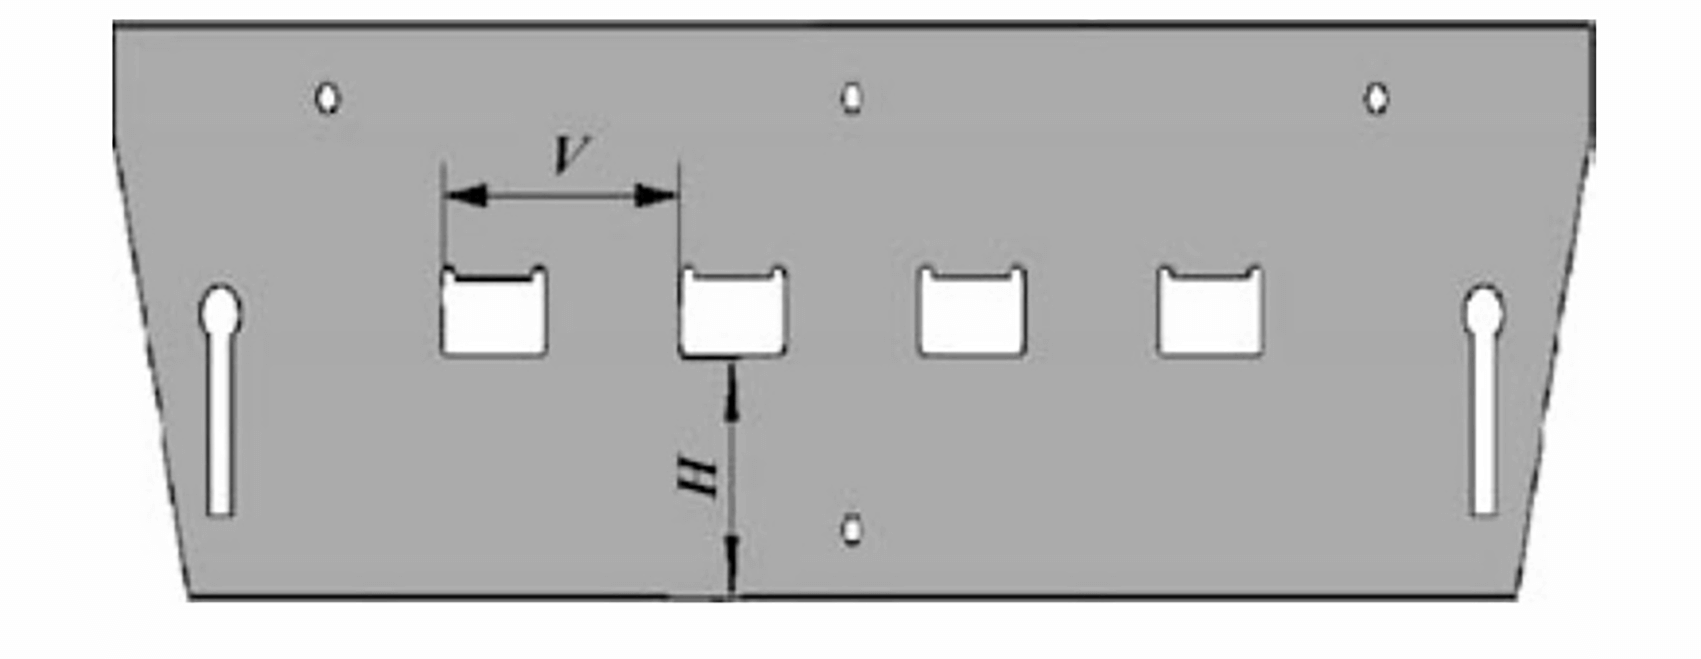
Fig. 5 Parameter configuration schematic diagram
The design takes into consideration the need for a reasonable layout in the length direction that does not affect aesthetics, while ensuring that the number of oil cylinders is four.
The acceptable range for V in the design parameter attribute table is 400-600 mm.
The acceptable range for H is between 236 and 436 mm, and the maximum value of p must not exceed the maximum compensation pressure. The acceptable range for p 1 is between 0 and 48.8 MPa.
The program was run to obtain the results of the sample design point calculation.
After analysis and calculation, it was found that the deformation curve of the work table is in good agreement with that of the slider when v = 528 mm, H = 307 mm, and p 1 = 45.9MPa. The maximum vertical deformation of the work table is 0.44 mm.
After rounding, the final values for v, H and p are 530 mm, 310 mm and 23.5 MPa, respectively.
Figure 6 shows a comparison of the vertical deformation between the optimized slider and the worktable.
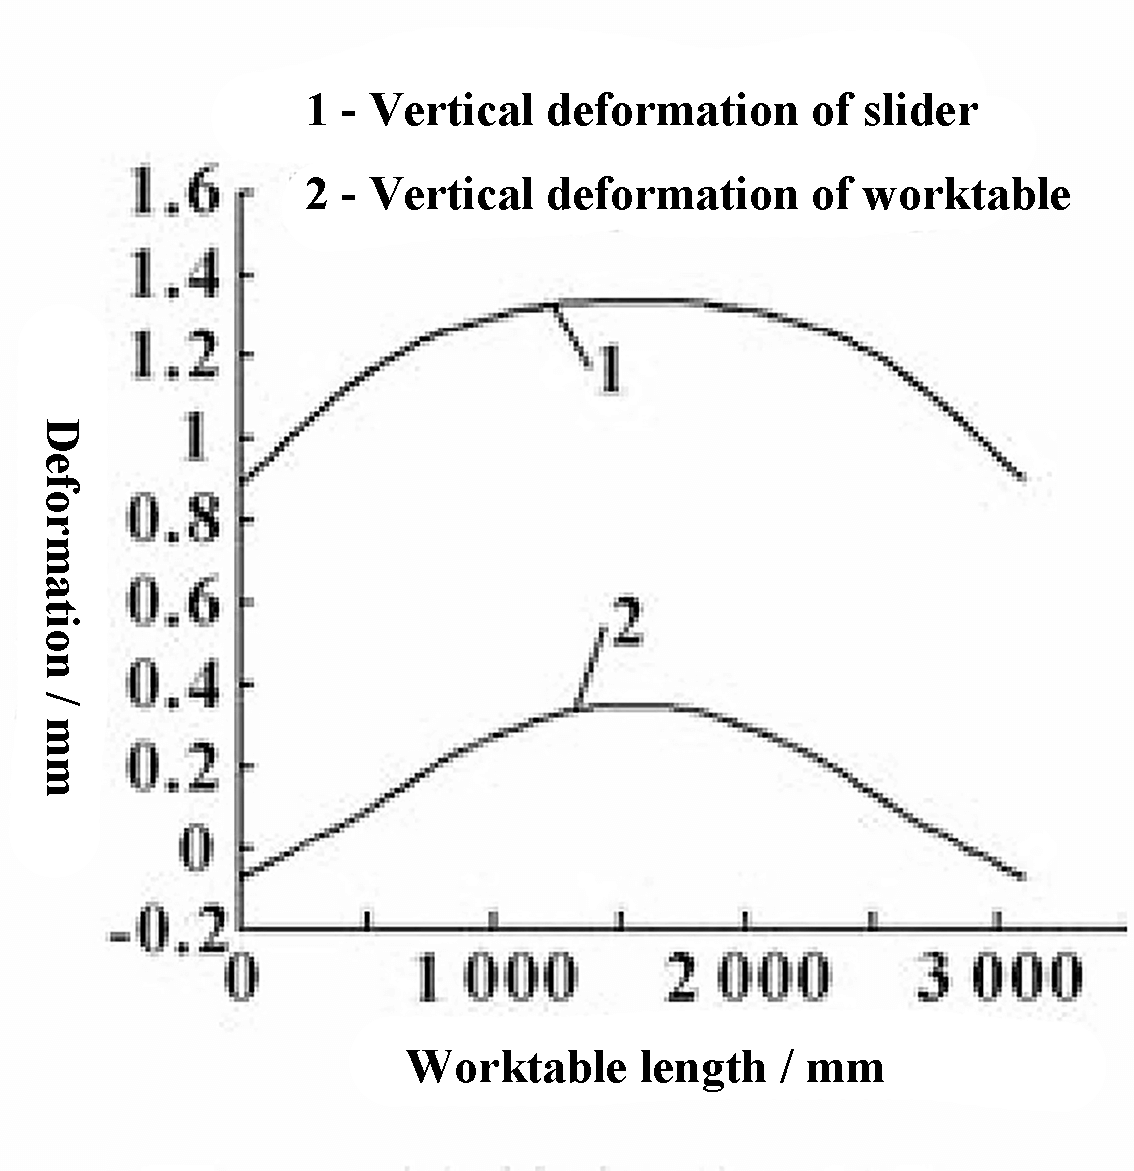
Fig. 6 Comparison of vertical deformation of sliding block and work table after compensation optimization
The deformation shown in Figure 6 for the slider is the absolute deformation calculated by the finite element method, which includes the superimposed deformation caused by insufficient rigidity of the fuselage. Therefore, there is a gap between the two curves in the figure.
However, the deformation of the middle section of the working end face of the slider and the worktable is similar to the vertical relative deformation of the two ends, and the deflection curves of both tend to be parallel.
This suggests that the compensation effect after optimization is more effective.
4.3 Sensitivity of response parameters
The sensitivity plot indicates that the output parameters are affected by the design point.
By modifying the design point value, you can observe how the output parameter changes in response to one or more input parameters.
As illustrated in Figure 7, based on the analysis of the sensitivity diagram, the vertical height and compensation pressure of the compensation cylinder exert the most significant influence on the deflection curve.
The horizontal distance between the cylinders has minimal impact on the maximum value of the deflection curve, but affects the smoothness of the deflection curve.
The analysis results are in line with the actual situation.
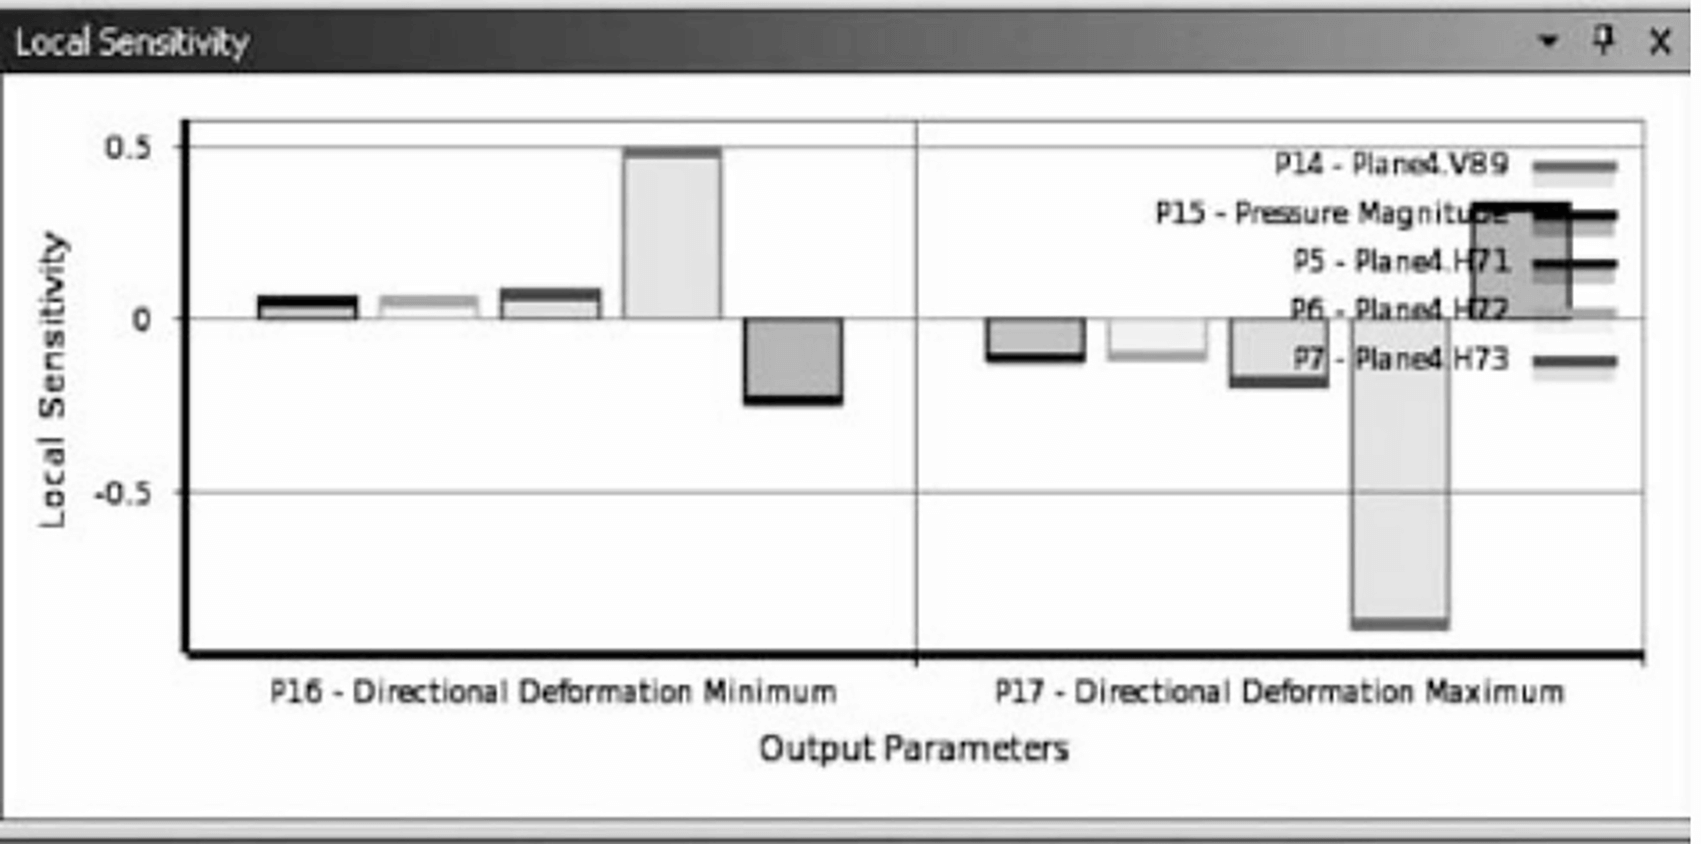
Fig. 7 Parameter sensitivity results at response points
5. Conclusion
This article analyzes the causes of low bending accuracy on the worktable of a press brake using finite element software.
Furthermore, it tests and compares the stress and strain of the machine tool by combining it with electrical strain measurement technology.
This process provides a basis for using finite elements to compensate for worktable pressure.
The typical working conditions of the press brake were optimized and the ideal compensation curve was obtained.