-

Aço Inoxidável Grau 316: Resistência Excepcional
O aço inoxidável grau 316 é amplamente reconhecido por sua resistência excepcional à corrosão, tornando-o uma escolha popular em uma ampla gama de aplicações industriais e marítimas. Neste artigo, ...
-

Latão vs Aço Inoxidável: Qual oferece melhor Resistência à Corrosão?
Latão e sua capacidade de resistir à corrosão, ao contrário da maioria dos metais
Uma das razões pelas quais o latão é considerado menos corrosivo em comparação a outros metais e provavelmente a qu...
-

Alumínio vs. Titânio: Explorando a relação Resistência-Peso
As transformações aceleradas na indústria hoje aumentaram significativamente a curiosidade em relação ao uso de materiais robustos, porém leves, impulsionando as comparações entre titânio e alumíni...
-
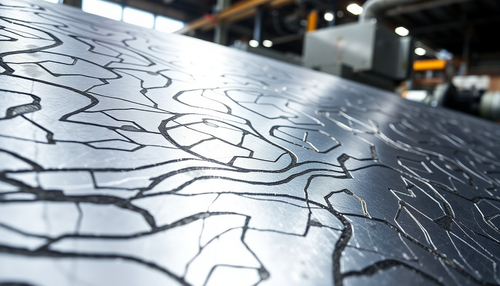
O que é Aço de Baixa Liga e como ele melhora as propriedades do Aço
O aço é um material fundamental para a indústria e a construção civil, sendo amplamente utilizado em uma variedade de aplicações, desde estruturas de edifícios até peças automotivas. No entanto, ne...
-
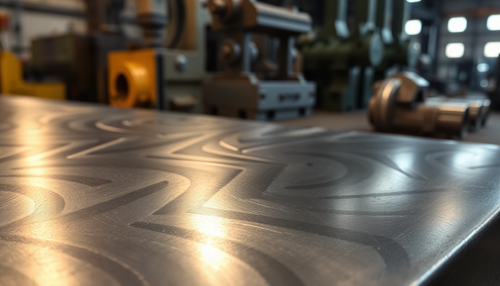
Aço de liga SAE 8620 (UNS G86200) – Equivalente, composição química, propriedades e usos
O aço de liga SAE 8620 (UNS G86200) é uma liga de aço muito respeitada por sua força, tenacidade e resistência ao desgaste. Essa liga é amplamente utilizada em diversas indústrias, como a automotiv...
-
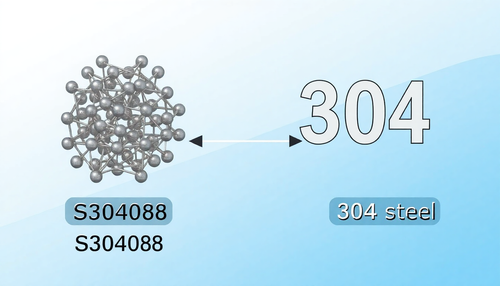
Aço Inoxidável S30408 vs. 304: Entendendo as Principais Diferenças
Você já se perguntou sobre as diferenças entre o aço inoxidável S30408 e o 304? Nesta postagem do blog, vamos nos aprofundar nas principais distinções entre esses dois materiais comumente usados. N...
-

Durabilidade Superior em Ambientes Externos com Aço Patinável
O aço patinável é uma solução inovadora que vem revolucionando a construção e o design de estruturas expostas a ambientes externos. Esse material apresenta características únicas que o tornam altam...
-

Aços Patináveis: A Solução Sustentável para Redução de Custos de Manutenção
A manutenção de estruturas metálicas é um desafio constante para empresas e governos em todo o mundo. Os custos associados à pintura, revestimentos e reparos regulares podem ser significativos, esp...
-
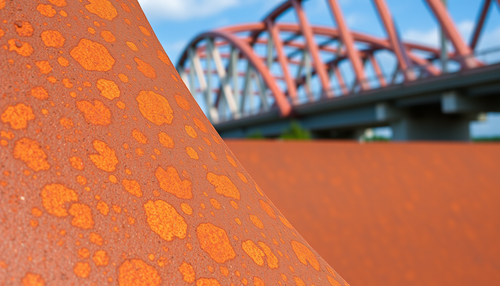
Aços Patináveis: A Escolha Sustentável para Construção e Infraestrutura
A sustentabilidade é um tema cada vez mais central nas discussões sobre construção e infraestrutura. À medida que a sociedade se torna mais consciente dos impactos ambientais, a demanda por soluçõe...
-

Durabilidade Superior em Ambientes Externos com Aço Patinável
O aço patinável é uma solução inovadora que vem ganhando cada vez mais espaço no mercado da construção civil e da indústria. Esse material possui características únicas que o tornam altamente resis...
-

Aço Patinável: A Solução Sustentável para Ambientes Corrosivos
A corrosão é um desafio constante para muitas indústrias, especialmente aquelas que operam em ambientes agressivos. No entanto, uma solução inovadora tem se destacado: o aço patinável. Esse materia...
-

Obras Sustentáveis com Aços Patináveis e Baixo Impacto Ambiental
A construção civil é um setor fundamental para o desenvolvimento econômico e social de qualquer país, mas também é responsável por uma parcela significativa dos impactos ambientais. Felizmente, exi...
-

Aços Patináveis: A Solução ideal para Estruturas Marítimas e Litorâneas
A indústria da construção civil e infraestrutura marítima enfrenta desafios únicos quando se trata de materiais de construção. Nesses ambientes, os elementos estão sujeitos a uma exposição intensa ...
-

Aço Patinável: A Solução Sustentável para Arquitetura Moderna
O aço patinável, também conhecido como aço corten, tem se destacado como uma opção cada vez mais atraente para projetos arquitetônicos sustentáveis. Diferente do aço convencional, este material pos...
-

Aços Patináveis em Estruturas de Alto Tráfego: Resistência e Durabilidade
Os aços patináveis têm se destacado como uma solução eficaz para estruturas submetidas a alto tráfego, como passarelas, estacionamentos e outras áreas públicas. Sua resistência à corrosão e a impac...
-

Estética e Funcionalidade em Arquitetura com Aço Patinável
O aço patinável, também conhecido como aço corten, é um material cada vez mais utilizado na arquitetura contemporânea devido às suas características únicas. Além de sua durabilidade, o aço patináve...
-

Soluções de Paisagismo com Aço Patinável: Durabilidade e Estética Natural
O aço patinável, também conhecido como aço corten, tem se destacado como uma opção versátil e atraente para projetos de paisagismo e esculturas ao ar livre. Sua aparência natural e resistência às i...
-

Aço Patinável: A Escolha Inteligente para Equipamentos de Transporte
O aço patinável, também conhecido como aço corten, é um material cada vez mais utilizado na fabricação de equipamentos de transporte, como vagões ferroviários, contêineres e outros. Isso se deve às...
-
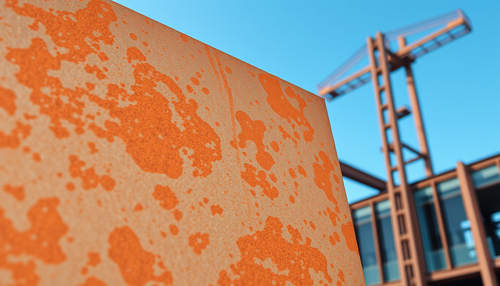
Aço Patinável: Uma Solução Econômica e Sustentável para a Proteção Anticorrosiva
O aço patinável, também conhecido como aço corten, tem se destacado como uma alternativa eficiente e econômica para a proteção anticorrosiva de estruturas metálicas. Essa tecnologia inovadora permi...


