A schedule is a sequence or plan of events or activities. It can be in the form of a graph or table showing when something will happen and how long it will take. Some people use timelines for project management, for example, to show what needs to be done and when. This can help the project manager stay on schedule and ensure that all deadlines are met. A Gantt chart is a type of bar chart that displays tasks along the horizontal axis according to their start date and duration along the vertical axis.
These graphics can be used in many different ways and can also be modified in many ways. Even more important is the fact that they can be used in different professional areas, by people to pursue their own needs or by large companies and organizations to pursue their biggest initiatives.
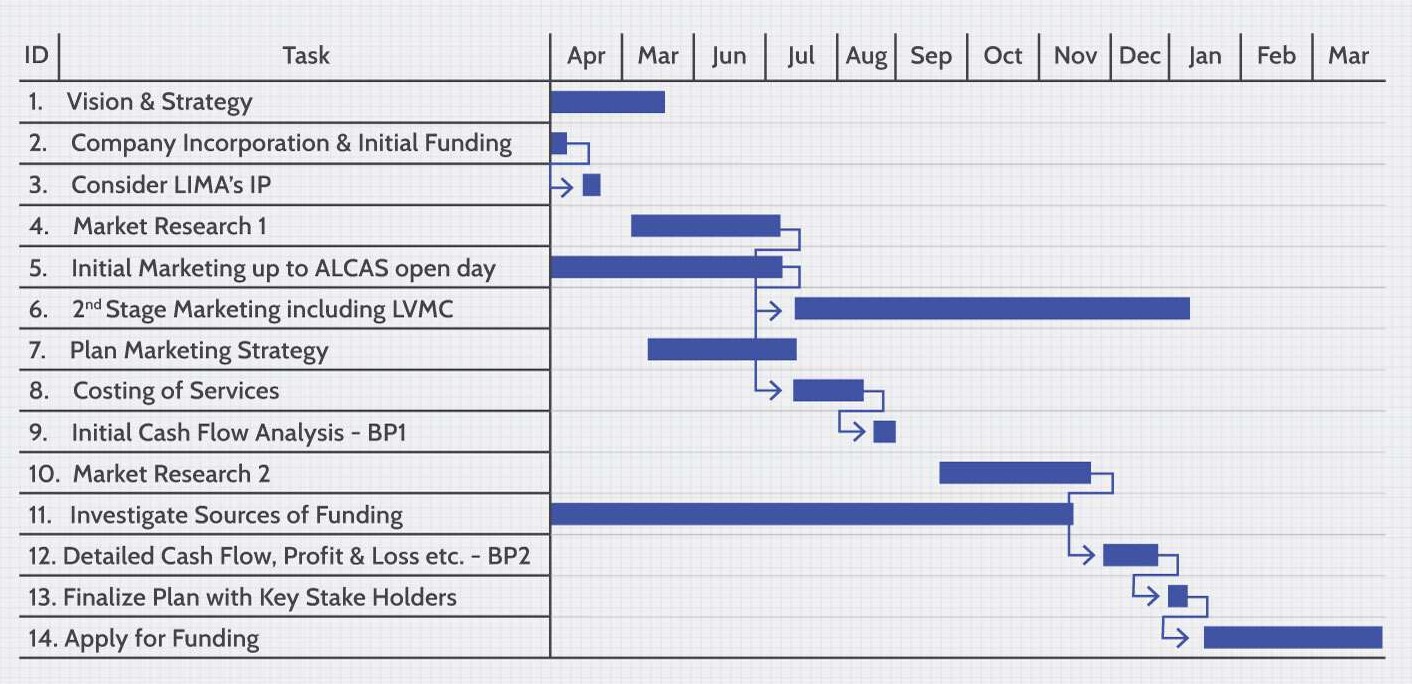
What is a Gantt chart?
A Gantt chart is a type of bar chart that displays a project's tasks or milestones, starting with the start date and ending with the end date.
The Gantt chart is an effective way to visualize the duration of a project and its various tasks. It can be used for small and large projects and is an easy way to manage all tasks in a timely manner. The Gantt chart can be drawn as a bar chart, where the bars represent project days and the columns represent different days or time periods.
Each day's progress can be summarized by showing the total number of hours spent that day. This number can then be displayed in different ways depending on how many different hours per day are being compared. The three steps to using this chart are:
1) Select the tasks to be included in the chart
2) Create a time scale from A to Z
3) Design and title bars and add text information

Gantt Chart History
Karol Adamiecki, a Polish engineer who supervised steel mills in southern Poland and developed an interest in management theories and practices, created the first Gantt chart in the mid-19th century.
Henry Gantt, an American engineer and project management expert, created his version of the diagram about 15 years after Adamiecki, and it was this version that gained wide recognition and popularity in Western countries. As a result, charts of this type became known as Henry Gantt.
How do I create a Gantt chart?
A Gantt chart is a type of bar chart that illustrates a project timeline. Typically, the duration of each task is displayed on the x-axis and the task start and end dates are displayed on the y-axis. The Gantt chart is named after its inventor, Henry Gantt, who developed it as a tool for large industrial engineering projects such as construction .
Gannt chart application
It's one of today's top project management tools and is designed for use across many industries. The information provided in the diagrams and the analysis carried out based on the information obtained in the diagrams are fundamental to the successful execution of a project.
The main applications of Gannt chart are as follows.
- Progress monitoring
- Project planning
- Font management
In addition to these uses, the following can also be considered detailed uses for this.
- Review information such as details of each task, deadlines, progress of each task, etc. This will help us get an idea of the progress of the project.
- The diagram allows you to easily communicate and evaluate the work of everyone involved. Depending on the observation, the work can be planned.
- Resource allocation and management can be done with project evaluation. After the initial resource allocation, necessary adjustments to the resources allocated to each task can be identified and adjusted as the project progresses.
- The most important aspect of developing such diagrams is evaluating the progress of the project and consequently making the necessary decisions to complete it successfully.
- Furthermore, each activity can be evaluated independently and necessary decisions can be made accordingly. As soon as we detect a critical activity that has delayed and affected the overall progress of the project, we take action to get it back on track.
- We can manage the project even without being on site. If we have the relevant information to update the diagram, we can effectively use this tool to provide an update to the project team.
- Since all information is accessible and readable by the client, engineer, project management team, contractor, etc., there are no misunderstandings during project execution.